Market Perspectives September 2023
Capital Markets
By: Wade Austin
Markets experienced increased volatility in August, mainly due to a spike in bond yields. The sell-off in risky assets was sparked on August 1, when Fitch Ratings lowered their credit rating on U.S. government debt, the government’s first debt downgrade since 2011. The combination of heightened concerns over the rising interest burden of government debt and the surprisingly resilient U.S. economy pushed 10-year U.S. Treasury yields as high as 4.34% by mid-August. This new cycle high was noteworthy because the consensus view at the beginning of 2023 was that yields had peaked last October, as a recession was imminent.
Despite a late-month retreat in yields and corresponding rally in stock prices, the S&P 500 snapped its five-month winning streak, returning -1.6% in August but still a robust 18.7% YTD. Monthly declines were steeper among U.S. small-cap (-5.0%), international developed (-3.8%), and emerging market (-6.2%) stock indexes. Among the 11 major sectors comprising the S&P 500, energy was the only gainer in August (+1.8%). With oil spiking a surprising 18% since the beginning of July, energy has been the best performer for two consecutive months. Utilities (-6.2%) was the month’s laggard, as higher interest rates are a headwind for the sector.
The stock market had broadened from late June through July, but leadership swung back to the mega-cap technology stocks beginning in August. The capitalization-weighted S&P 500 has outgained the same 500 stocks on an equal-weighted basis by 11.4% YTD. The so-called “Magnificent 7” (Apple, Microsoft, Google, Amazon, Nvidia, Tesla, and Meta) have dominated the other “Unremarkable 493” stocks primarily due to being early adopters of the nascent but potentially transformative generative AI technology. The Magnificent 7’s increased productivity gains and operating efficiencies have contributed to outsized profitability. During Q2, EPS among the other 493 companies declined 14.0% YOY, while the S&P 500 composite declined only 5.2%. Performance within small-cap stocks has experienced a similar divergence, as the cap-weighted Russell 2000 has outperformed the equal-weighted index by 6% YTD.
Given August’s bounce in yields, the Bloomberg U.S. Aggregate Bond Index struggled to a -0.64% monthly return but maintained a modest 0.74% YTD gain. Although almost all fixed income sectors declined in August, high-yield corporate bonds (+0.28%) and short-term, 1-3 Month Treasury Bills (+0.46%) produced monthly gains. The Bloomberg U.S. Aggregate Bond Index is suffering its longest bear market in history. Since August 2020, the benchmark U.S. bond index has declined 17.2%. The previous largest drawdown was 12.7%, experienced from August 1979 through April 1980.
COVID created economic distortions and reactions still reverberating throughout markets today (e.g., the Federal Reserve’s record pace of interest rate hikes). With little corporate or economic news expected over the next month, all eyes are focused on inflation readings. And with inflation and economic growth slowing, stock prices are most likely to react to fluctuations in interest rates. It is also worth noting that September through early October has been the weakest seasonal period for stocks.
However, timing markets is a difficult endeavor. As noted in last month’s Market Perspectives, the stock market in 2023 is best characterized as another year of “climbing the Wall of Worry.” Looking back to the first quarter and on the heels of a brutal 2022, U.S. Treasuries and money market funds yielding 5% looked especially attractive and still do for balanced portfolios. But as it turned out, the S&P 500’s 16% YTD return through September 8 has been much better. Persistent inflation, long-term high interest rates, and rising bond yields remain valid risks and could metastasize into a recession. However, according to our Director of Economics, John Silvia, the current fundamentals of the U.S. economy remain too strong. Therefore, and among other inputs, we resist the temptation to be overly cautious.
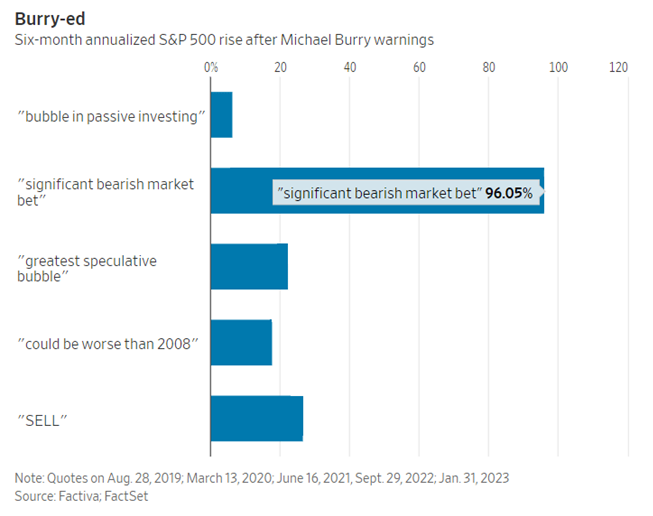
Michael Burry, who correctly predicted the impending 2008 housing bubble, recently announced a bearish bet on the U.S. stock market. While his “big short” proved to be a legendary trade (and made for an entertaining movie), his other bets have turned out to be big mistakes. Our Chart of the Month lists Burry’s market calls over the past five years. Instead of following his warnings, simply buying the S&P 500 would have earned money each time with an average annualized return of 34% over the subsequent six months. The “get in, get out” mentality may be effective as clickbait and headline grabbers for the media but not for generating consistent, long-term investment results.
Insights by John Silvia, Director of Economics

Two distinct developments have influenced financial markets over the past month. First, stronger than expected economic growth has diminished the probability of recession and Fed easing policy. Second, higher energy prices have reduced expectations for a more rapid decline in measured inflation.
- The expectation for stronger economic growth has been a driving force for markets. Recession forecasts for 2023 have disappeared. Why? As reported in the latest GDP accounts, consumer spending and business investment have been strong in the first half of this year. Leading indicators such as lower jobless claims still signal growth ahead.
- Consumer spending and income reports support the more positive economic outlook. Real personal disposable income and spending were up 2.2% and 2.9% over the last three months. In August, consumer sentiment was reported above the level of three months ago, with both consumer current assessment and expectations up over three months ago.
- Gains in household income reflect increases in employment, hours, and wages. Employment gains have averaged 150K over the last three months. Meanwhile, wages are up 4.5%, and aggregate hours worked are also up 2.5%. Both wages and aggregate hours were up in the last three months at a pace above a year ago.
- Business investment gains have been solid in structures and equipment spending. There are signs of moderation here as core nondefense, ex-aircraft goods orders and shipments are both below the pace of two months ago. Unfilled orders have also moderated.
- Recent gains in productivity have improved the outlook for the moderation of inflation and support the case for reduced cost pressures and increased profit gains. Higher productivity is also associated with lower inflation and higher profits over time, despite higher real wages. These results are positive for investors.
- The long-run Treasury market outlook remains a concern. A continued rise in the debt-to-GDP ratio over the years ahead, as projected by the Congressional Budget Office, tends to be associated with higher inflation. The Fitch downgrade reflected their assessment of the fiscal outlook and the poor governance around the debt ceiling and spending paths. This rerating would suggest higher real Treasury rates ahead.
- Recent U.S. dollar strength reflects a reversal of sentiment on the pace of economic growth both here and abroad. U.S. expectations for better growth, combined with lower expectations for growth in the Eurozone, the U.K., and China, have reversed the dollar decline in earlier months.
- Corporate profits remain a challenge for investors as global growth prospects have diminished. Nonfinancial domestic profits fell in both Q1 2023 and Q4 2022. The continued rise in unit labor costs for businesses, up 4.2% in Q1, has impacted realized profits and is also influencing expectations for valuations going forward.
- Two signals guide the change in the inflation/interest rate outlook and the financial markets. The Atlanta Fed core sticky price inflation measure, at 5.5% in July, signals a valuation problem for assets priced to the lower inflation/interest rates regime of pre-2022. As a second benchmark, in June, the Fed raised the terminal federal funds rate for December 2023 to 5.6%, above the 5.1% estimated in March and above the below 1% readings for 2020-2022.
- In retrospect, we retained our focus on the next three- to five-year horizon, given that the difficult period of late 2022/early 2023 would eventually give way to better economic and financial times. This focus has turned out to be correct, given the financial market’s performance in recent months.
- For fixed income investors, the “high-for-longer” theme from the Fed amplifies the case for a reassessment of market interest rate expectations and how the long-run path of inflation and interest rates will influence the returns on cash, bonds, and equities.
- For international investors, sovereign debt fundamentals in the Eurozone and the U.K. have deteriorated (i.e., slower economic growth and higher interest rates), especially for emerging markets. The China reopening continues to be disappointing in terms of the pace of growth.
Quote of the Month
“Forecasts are for show, disciplines are for dough.”
Steve Leuthold – Investment Strategist, Manager, and Researcher
Chart of the Month
The information published herein is provided for informational purposes only, and does not constitute an offer, solicitation or recommendation to sell or an offer to buy securities, investment products or investment advisory services. All information, views, opinions and estimates are subject to change or correction without notice. Nothing contained herein constitutes financial, legal, tax, or other advice. The appropriateness of an investment or strategy will depend on an investor’s circumstances and objectives. These opinions may not fit to your financial status, risk and return preferences. Investment recommendations may change, and readers are urged to check with their investment advisors before making any investment decisions. Information provided is based on public information, by sources believed to be reliable but we cannot attest to its accuracy. Estimates of future performance are based on assumptions that may not be realized. Past performance is not necessarily indicative of future returns. The following indexes were used as proxies in the performance tables: Global Stocks = MSCI ACWI; U.S. Large Cap = S&P 500; U.S. Large Value = Russell 1000 Value; U.S. Large Growth = Russell 1000 Growth; U.S. Small Cap = Russell 2000; Int’l Dev Stocks = MSCI EAFE; Emerging Markets = MSCI EM; U.S. Inv Grade Bonds = Barclays U.S. Aggregate; U.S. High Yield Bonds = Barclays Corporate High Yield; Emerging Markets Debt = JPMorgan EMBI Global Diversified; Int’l Bonds = Barclays Global Treasury ex US; Cash = 3month T-Bill; Sector returns displayed in the chart represent S&P 500 sectors, while treasury benchmarks are from Barclays
Source: Schwab Center for Financial Research with data provided by Morningstar, Inc., as of 3/31/2022. Asset class performance represented by annual total returns for the following indexes: S&P 500® Index (US Lg Cap), Russell 2000® Index (US Sm Cap), MSCI EAFE® Net of Taxes (Int’l Dev), MSCI Emerging Markets IndexSM (EM), MSCI US REIT Index (REITs), S&P GSCI® (Comm.), Bloomberg Barclays U.S. Treasury Inflation-Linked Bond Index (TIPS), Bloomberg Barclays U.S. Aggregate Bond Index (Core US Bonds), Bloomberg Barclays U.S. High Yield Bond Index (High Yield Bonds), Bloomberg Barclays Global Aggregate Ex-USD TR Index (Int’l Dev Bonds), Bloomberg Barclays Emerging Markets USD Bond TR Index (EM Bonds), FTSE U.S. 3-Month T-Bill Index (T-Bills). Past results are not an indication or guarantee of future performance. Returns assume reinvestment of dividends, interest, and capital gains. Indexes are unmanaged, do not incur fees or expenses, and cannot be invested in directly.
Chart of the Month: Factiva, FactSet, Charlie Bilello
Chart of the Month
Quote of the Month
“Forecasts are for show, disciplines are for dough.”
Steve Leuthold – Investment Strategist, Manager, and Researcher
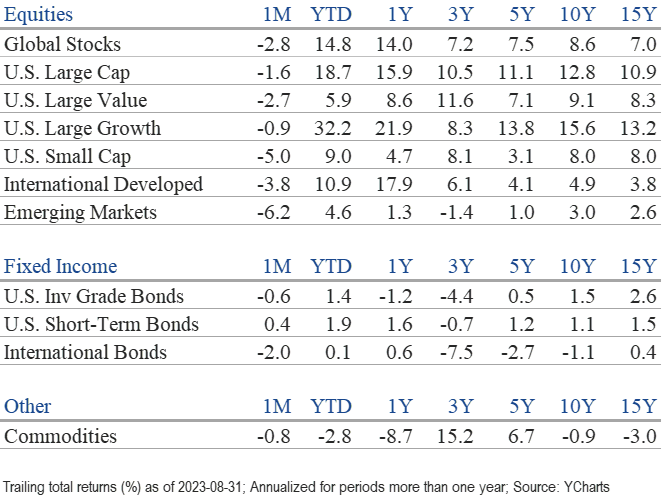
Trailing Returns