Market Perspectives August 2023
Capital Markets
By: Wade Austin
Entering 2023, the consensus view among economists was that a recession was a near certainty by year-end. Meanwhile, Wall Street strategists forecasted the first negative year for the S&P 500 in over 25 years. However, as Yogi Berra famously proclaimed, “It’s difficult to make predictions, especially about the future.”
In actuality, fears of a recession have steadily faded due to a surprisingly resilient U.S. labor force, inflation’s swift slowdown, unexpected productivity gains fueled by emerging AI technologies, corporate earnings that consistently beat analyst projections, and expectations that the Federal Reserve’s tightening cycle is near its conclusion. As fresh economic data reaffirmed developing disinflation and soft-landing narratives, U.S. and global stocks climbed higher in July.
The S&P 500 scaled the proverbial ‘Wall of Worry’ to its fifth consecutive month of gains, a 20.6% July YTD return, and within 4% of its previous January 3, 2022 high. Remarkably, most of the YTD gains have occurred since the banking crisis in March. Meanwhile, the Dow Jones Industrial Average finally joined the ascent, culminating in a rare 13-day winning streak the last week of July – its longest since 1987. With eggs on their faces, many on Wall Street were offering mea culpas and confessing this to be the most unloved rally in recent memory.
Given the sharp downward moves in equity markets last year, subdued volatility this year has been a welcome respite. However, volatility in fixed income markets has continued to rise. Based on the percent of trading days with at least a 10 bps move on the U.S. 2-year Treasury, 2023 is the most volatile year since 2008, 2022 and 2023 combined are the most volatile back-to-back years since the 1980s. With the 10-year U.S. Treasury yield marching back to 4.0% and testing early March highs, fixed income returns have been negative over the past three months but maintained YTD gains. High-yield bonds (+6.8%) have been the top performer by a wide margin as the risk of defaults has receded with recession fears.
The primary concern for equity markets in June was the top-heavy nature of the S&P 500. Contribution of total performance from the ten largest weights, led by “The Magnificent Seven” (Apple, Microsoft, Google, Amazon, Nvidia, Tesla, and Meta), approached record levels. In a positive signal for the overall stock market, performance broadened in July. Small caps rallied and outperformed large caps while value outpaced growth in the U.S. and abroad. All eleven major S&P 500 sectors delivered positive returns in July. After being the laggard through June, energy was the top performer in July, posting a 7.4% gain. A healthy market should broaden further as the dispersion of returns among sectors on a YTD basis remained extreme.
In a complete reversal from last year, the risk-on sectors – technology (+46.6%), communication services (+45.7%), and consumer discretionary (+36.3%) – have soared this year. Many low-quality stocks, defined primarily by negative earnings and high short interest, have also rallied sharply. These companies were huge winners in 2020 and early 2021 but were crushed back in mid-2021 through 2022. According to research from The Leuthold Group, the fifty most shorted names were up an average of 45% YTD and 17% in July! Meanwhile, the defensive, risk-off sectors that were leaders in 2022 – namely, utilities (-3.4%) and health care (-0.5%) – have failed to break even this year.
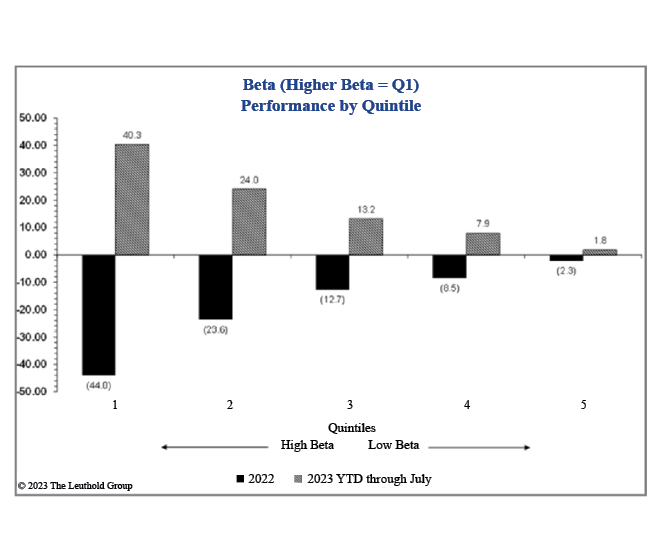
Swings are not unusual but have become extreme in recent years. As investors crowd into risk-on or risk-off assets at the same time, the probability of sharp reversals increases. Our Chart of the Month depicts the dramatic turnaround in risk appetite from 2022 to this year. Beta is a measure of a stock’s volatility in relation to the overall market or its benchmark, in this case, the S&P 500. The most volatile quintile of stocks experienced the sharpest reversals, while the least volatile grouping has performed most similarly year-over-year.
Based on history, the probability of the S&P 500 finishing the year higher when up double digits through July is surprisingly high. On the other hand, economic soft landings are extremely rare. The Federal Reserve achieved this goal just once in the last 60 years. As such optimism has increased, equity prices have risen to expensive levels. A forward P/E of 19x (compared to the 20-year average of 15.5x) is not cheap, but valuation is never a catalyst. As August and September have historically been weaker months for markets, a pause or moderation would not be a surprise, especially if inflation or rates tick higher. For patient investors, a pullback could also recreate bargain values that would extend the bull market that began ten months ago.
Insights by John Silvia, Director of Economics

Positive economic growth expectations have been the driving force for markets. Recession forecasts for 2023 have disappeared. Why? Both consumer spending and business investment have been strong in the first half of this year. Leading indicators still signal growth ahead, and inflation trends have moderated.
- Consumer spending and income reports support the more positive economic outlook. Real personal income and spending were up 2.2% and 3.9% over the last three months. July consumer sentiment was above the level of three months ago, with both consumer current assessment and expectations up over three months ago.
- Last Friday’s employment report provides further support for consumer spending. Employment gains have averaged 218K over the previous three months. Meanwhile, wages are up 4.9%, and aggregate hours worked were also up. More workers at higher wages is a plus for consumer spending.
- Regarding business and investment, the leading indicators are also positive. Core durable goods orders and shipments were both above two months ago, while unfilled orders have also risen. A rise in unfilled orders signals future production improvements down the road.
- One more positive economic development recently came from the nonfarm labor productivity report. Although this report receives little media attention, the improvement in productivity has several positive implications. Higher productivity tends to be associated with higher real wages paid to workers. Higher productivity is also associated with lower inflation and higher profits over time despite the higher real wages. These results are positive for investors.
- The Fitch downgrade of U. S. sovereign debt reinforces our concern for the long-run outlook. The rise in the debt-to-GDP ratio over the years is associated with higher inflation. The Fitch downgrade reflected their assessment of the fiscal outlook and the poor governance around the debt ceiling and spending paths.
- Over time, investors should anticipate slightly higher inflation and interest rates because of the rising federal debt-to-GDP ratio.
- Over the last three months, the decline in the value of the U. S. dollar reflects the debt ceiling debate. Also, there is a sense that the Fed is approaching the peak for policy rates, and according to recent surveys, the Fed will begin easing policy rates in early 2024.
- Corporate profits remain a challenge for investors. Although recent individual earnings reports have been positive, for the overall economy, nonfinancial domestic profits fell in both the first quarter of 2023 and the fourth quarter of 2022. The continued rise in unit labor costs, up 4.2% in the first quarter, for business has impacted realized profits and expectations for valuations going forward.
- Although better economic growth numbers have generally supported investor sentiment, the outlook for persistent, above-target inflation and, thereby, “higher for longer” interest rates would prompt a revaluation of equity and corporate credit positions for selected equities and corporate exposure. We believe the economy has moved to a higher regime for inflation and interest rates. There is no return to the 2012-2019 period.
- Persistent inflation above what the Fed and markets anticipated earlier this year remains a driving force for policy and the financial markets. The Atlanta Fed core sticky price inflation measure, at 5.6% in June, signals a valuation problem for assets priced to lower inflation/interest rates. As a benchmark, in June, the Fed raised the terminal federal funds rate for December 2023 to 5.6%, above the 5.1% estimated in March and above the below 1% readings for 2020-2022.
- For investors and the Fed, leading indicators of inflation, such as the Price Pressures Measure from the St. Louis Fed, do hint at inflation moderation. Yet, the outlook remains for rate increases ahead and for “higher for longer” interest rate levels in the next two years.
- While forecasts of recession have drifted away, U. S. financial markets continue to adjust to the economic reality of moderate but positive trend-like economic growth, “higher for longer” interest rates, but lower profit expectations for the year ahead compared to the pre-pandemic period.
- In retrospect, we retained our focus on the next three-to-five-year horizon, given that the difficult period of late 2022/early 2023 would eventually give way to better economic and financial times. This focus has turned out to be correct, given the financial market’s performance in recent months.
- For fixed income investors, the “higher for longer” theme from the Fed amplifies the case for a reassessment of market interest rates expectations and how the long-run path of inflation/rates will influence the returns on cash, bonds, and equities.
- For international investors, sovereign debt fundamentals in the Eurozone and the U.K. have deteriorated (slower economic growth, higher interest rates), especially for emerging markets. The China reopening continues to be disappointing in terms of the pace of growth.
Quote of the Month
“History shows us, over and over, that bull markets can go well beyond rational valuation levels as long as the outlook for future earnings is positive.”
Peter Bernstein – American Financial Historian and Economist
Chart of the Month
The information published herein is provided for informational purposes only, and does not constitute an offer, solicitation or recommendation to sell or an offer to buy securities, investment products or investment advisory services. All information, views, opinions and estimates are subject to change or correction without notice. Nothing contained herein constitutes financial, legal, tax, or other advice. The appropriateness of an investment or strategy will depend on an investor’s circumstances and objectives. These opinions may not fit to your financial status, risk and return preferences. Investment recommendations may change, and readers are urged to check with their investment advisors before making any investment decisions. Information provided is based on public information, by sources believed to be reliable but we cannot attest to its accuracy. Estimates of future performance are based on assumptions that may not be realized. Past performance is not necessarily indicative of future returns. The following indexes were used as proxies in the performance tables: Global Stocks = MSCI ACWI; U.S. Large Cap = S&P 500; U.S. Large Value = Russell 1000 Value; U.S. Large Growth = Russell 1000 Growth; U.S. Small Cap = Russell 2000; Int’l Dev Stocks = MSCI EAFE; Emerging Markets = MSCI EM; U.S. Inv Grade Bonds = Barclays U.S. Aggregate; U.S. High Yield Bonds = Barclays Corporate High Yield; Emerging Markets Debt = JPMorgan EMBI Global Diversified; Int’l Bonds = Barclays Global Treasury ex US; Cash = 3month T-Bill; Sector returns displayed in the chart represent S&P 500 sectors, while treasury benchmarks are from Barclays
Source: Schwab Center for Financial Research with data provided by Morningstar, Inc., as of 3/31/2022. Asset class performance represented by annual total returns for the following indexes: S&P 500® Index (US Lg Cap), Russell 2000® Index (US Sm Cap), MSCI EAFE® Net of Taxes (Int’l Dev), MSCI Emerging Markets IndexSM (EM), MSCI US REIT Index (REITs), S&P GSCI® (Comm.), Bloomberg Barclays U.S. Treasury Inflation-Linked Bond Index (TIPS), Bloomberg Barclays U.S. Aggregate Bond Index (Core US Bonds), Bloomberg Barclays U.S. High Yield Bond Index (High Yield Bonds), Bloomberg Barclays Global Aggregate Ex-USD TR Index (Int’l Dev Bonds), Bloomberg Barclays Emerging Markets USD Bond TR Index (EM Bonds), FTSE U.S. 3-Month T-Bill Index (T-Bills). Past results are not an indication or guarantee of future performance. Returns assume reinvestment of dividends, interest, and capital gains. Indexes are unmanaged, do not incur fees or expenses, and cannot be invested in directly.
Chart of the Month: The Leuthold Group
Chart of the Month
Quote of the Month
“History shows us, over and over, that bull markets can go well beyond rational valuation levels as long as the outlook for future earnings is positive.”
Peter Bernstein – American Financial Historian and Economist
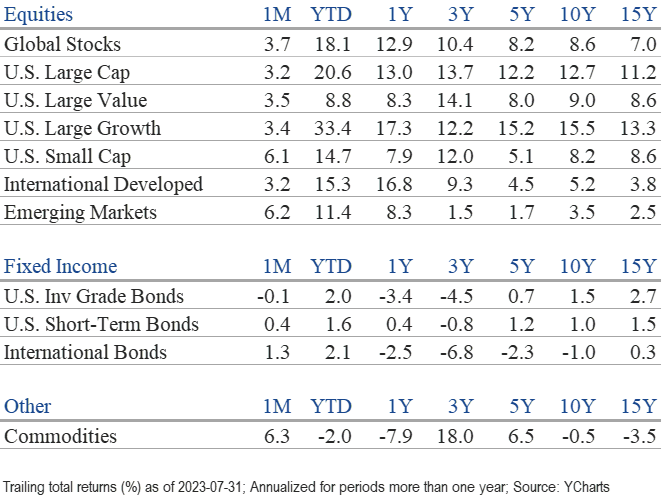
Trailing Returns