Market Perspectives October 2023
Capital Markets
By: Wade Austin
Sept. was the worst month of 2023 for equities and the second worst for bonds, despite a resilient U.S. economy that continued to grow. The culprit was a relentless rise in oil prices, interest rates, and the U.S. Dollar.
WTI crude oil began the summer in the $60s (per barrel) and marched higher in July and Aug. before peaking in the low $90s by late Sept. The 10-year U.S. Treasury note yield began Q3 at 3.82%, ended the quarter at 4.57%, and reached 4.8% by Oct. 3. By the quarter’s end, the U.S. Dollar had risen for 11 consecutive weeks—a remarkable feat that ranks as the second-longest winning streak in the index’s history.
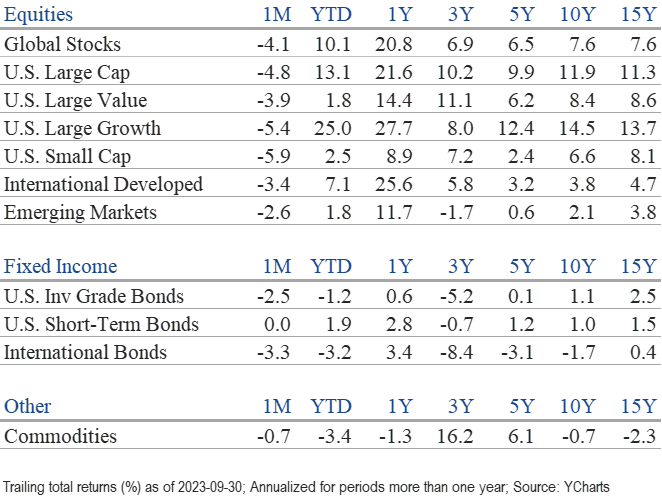
While the Federal Reserve announced a pause in interest rates at its Sept. meeting and indicated the odds for a soft landing of the U.S. economy were increasing, they also altered their projection for keeping interest rates “higher for longer.” A soft landing is undoubtedly preferable to a recession. Still, investors were forced to re-price assets, adjusting valuations for the implications of stickier inflation, accelerating rates, and a “higher-for-longer” rate environment. The trio’s collective surge could have a sinister impact on financial markets if the trend continues. Of nine major asset classes, only two saw gains during Q3. Commodities rose 4.7%, and cash rose 1.3%.
As higher money market rates and bond yields provided increasingly attractive competition, equities experienced their second consecutive monthly decline in Sept., with the S&P 500 falling 4.8%. Small cap stocks fared worse, falling 5.9%, while international and emerging market stocks suffered more modest declines at 3.6% and 2.4%, respectively. Ten of the 11 sectors comprising the S&P 500 registered negative total returns for the month, with real estate the laggard at -7.3%. Once again, energy was the top performer, up 2.6%. Communication services joined energy as the only winners during Q3. On a YTD basis, the S&P 500 Index maintained a strong 13.1% total return, but the dispersion between the largest stocks and the rest of the market was extreme. The 50 largest S&P 500 stocks were up 25%, while the S&P 500 Equal Weight Index gained only 1.7%.
The Bloomberg U.S. Aggregate Bond Index returned -2.5% in Sept., which turned its YTD return negative (-1.2%). The 38-month progression in yields from the record low in March 2020 has been painful for existing bond investors. However, our overweight of short-term bonds has proven beneficial, as they have maintained positive returns on a YTD basis (+1.9%). Meanwhile, the 10-year U.S. Treasury bond is on pace to post its first-ever third straight calendar year decline.
This Thursday, Oct. 12, marks the first anniversary of the 2022 bear-market low. The S&P 500 has rallied 22.4% since the bottom, even with the -6.6% selloff since the summer peak on July 31. The index sits 11% from a new all-time high, last set on Jan. 3, 2022. We are also about to exit the worst seasonal period for stocks historically. Twelve of the past 13 Sept. selloffs were followed by Oct. rebounds, including last year’s 8.1% bounce.
In the near term, seasonality may work again in favor of investors. The price of oil has retreated recently, as demand typically ebbs exiting the busy summer travel season. Friday’s surprisingly strong job report (accompanied by muted wage growth) suggests corporate earnings also may prove resilient and foretell some upside surprises during the Q3 earnings reporting season that kicks off this week.
The panic in the bond market may soon run its course. With yields reaching their highest levels since 2007, bonds appear increasingly attractive moving forward. By many technical measures, stocks and bonds are oversold. However, expecting an extended bull market rally is difficult until bond yields settle down.
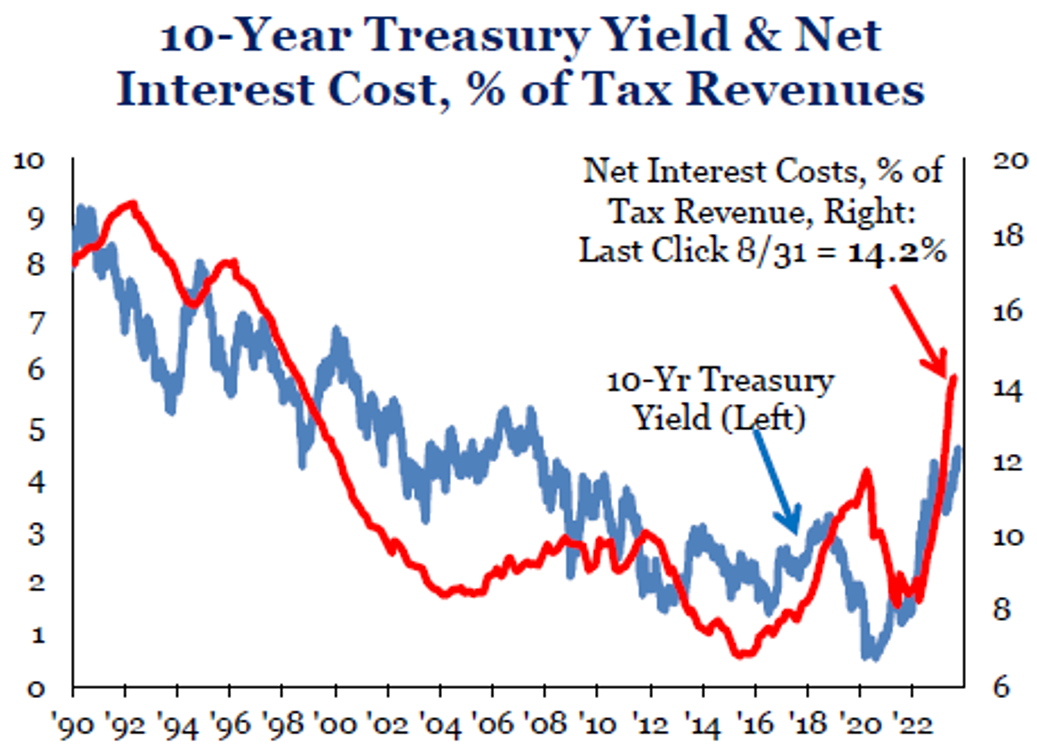
Concerns about dysfunction in Washington and U.S. fiscal policy headwinds recently have become a significant source of bond market anxiety. The budget deficit is running at 7% of GDP despite near full employment, while the federal debt has risen to nearly 120% of GDP. Furthermore, U.S. debt servicing costs hit 14% of tax revenue in July. Since crossing the historically critical 14% threshold, 10-year Treasury yields spiked from 3.96% to 4.8%. Our Chart of the Month shows that 10-year Treasury yields are highly correlated to the net interest costs on the government’s debt. Additional moderation of inflation and needed fiscal restraint would help appease those bond investors currently sending a no-confidence message to elected officials in Washington.
Lastly, regarding Hamas’ horrific attack on Israel and the resulting human tragedy in the Middle East, we want to be careful drawing conclusions about economic and market impacts. While the initial spike in oil prices and flight to traditional safe-haven assets (Treasurys and the U.S. dollar) is logical, such reactions haven’t always proven durable after previous geopolitical events or even prior Middle East wars. Geopolitical events are an ever-present consideration for investors but impossible to precisely anticipate. Strategic diversification helps protect portfolios against unforeseen risks but also provides investors exposure to markets’ many opportunities.
Insights by John Silvia, Director of Economics

Treasury note yields have risen sharply over the last month but not without good reasons. Interest rates reflect expectations for economic growth, inflation, Fed policy, and politics. Expectations are factored into the price of any asset—home prices, equities, and bonds. Over the past few months, the actual data has surpassed what was expected in the markets.
- First, economic growth has been stronger than expected. In the Federal Open Market Committee’s (FOMC) latest economic projections, the pace of growth for 2023 was revised from 1% up to 2.1%. In addition, private market analysts have dropped their near-term expectations for recession. The FOMC’s projected unemployment rate for 2023 declined to 3.8% from 4.1% back in June.
- Expectations for more robust economic growth reflected increased consumer spending and business investment gains. Real consumer spending is up 3.8% over the last three months. Business investment has been strong across the board, including in structures, equipment, and intellectual property. Leading indicators, such as lower jobless claims and core capital goods orders, signal growth ahead.
- The latest employment numbers reinforced expectations for stronger economic growth. For Sept., employment was up 366,000 and an average of 266,000 over the last three months. These gains are above average and signal a stronger-than-trend pace of economic growth.
- Second, inflation expectations have risen. The FOMC raised its expectations for both overall and core inflation targets for 2025. Also, the price pressures measure of inflation probabilities (St. Louis FRB) in the year ahead signaled a better than 80% probability that the inflation rate would exceed its target a year ahead.
- Third, the FOMC raised its target funds rate from 4.6% to 5.1% for 2024. For 2025, the FOMC raised its target funds rate to 3.9% from 3.4%.
- Finally, the politics of the debt ceiling and the ouster of the House Speaker have raised concerns about another possible government shutdown and downgrading of the U. S. credit rating.
- Contrary to many doom-and-gloom reports, business investment gains have been strong in structures. Office asking rents are rising in Charlotte, Phoenix, Tampa, and Dallas-Fort Worth. Retail asking rents are up in Orlando, Tampa, Atlanta, and Phoenix. Industrial asking rents are up in many areas, especially Columbus, Jacksonville, and Ft. Lauderdale.
- Recent gains in productivity have improved the outlook for the moderation of inflation and support the case for reduced cost pressures and increased profit gains. In Q2, productivity was up 3.5%, compared to a year-over-year gain of 1.3%. Higher productivity tends to be associated with lower inflation and greater profits over time, despite higher real wages. These results are positive for investors.
- To pick up on our earlier commentaries, the forecast for higher long-run Treasury market yields has indeed come to pass. Recession and Fed easing forecasts have disappeared. Moreover, a continued rise in the debt-to-GDP ratio over the years ahead, as projected by the Congressional Budget Office, and the threat of another downgrade will be associated with higher inflation and thus higher interest rates for the long term. As we advance, we do expect that the 10-year yield will decline modestly over the next year as inflation moderates and the Fed holds policy rates steady. Political uncertainty is a wildcard, however.
- Our outlook for a stronger dollar has also been borne out. Recent U. S. Dollar strength reflects a reversal of sentiment on the pace of economic growth both here (no recession) and abroad (weaker recovery). U.S. expectations for better growth, combined with lower expectations for growth in the Eurozone, the U.K., and China, have reversed the dollar decline in earlier months.
- Corporate profits remain a challenge for investors as global growth prospects have diminished. Pre-tax profits rose just 2.2% in Q2 and are down 2.7% over a year ago. The continued rise in unit labor costs and interest rates for businesses has impacted realized profits and expectations for valuations going forward.
- Persistent, above-target inflation and steady (no easing) Fed policy have forced a revaluation of the discounted value of future earnings. This inflation has suggested that interest rates will remain “higher for longer” and will offer investors a real alternative to equity earnings.
- While forecasts of recession have drifted away, U. S. financial markets continue to adjust to the economic reality of moderate but positive trend-like economic growth, “higher-for-longer” interest rates, and lower profit expectations for the year ahead compared to the pre-pandemic period.
- In retrospect, we retained our focus on the next three-to-five-year horizon, given that the difficult period of 2022/early 2023 would eventually give way to better economic and financial times.
Quote of the Month
“Skepticism and pessimism aren’t synonymous. Skepticism calls for pessimism when optimism is excessive. But it also calls for optimism when pessimism is excessive.”
Howard Marks – American Investor and Co-founder of Oaktree Capital Management
Chart of the Month
The information published herein is provided for informational purposes only, and does not constitute an offer, solicitation or recommendation to sell or an offer to buy securities, investment products or investment advisory services. All information, views, opinions and estimates are subject to change or correction without notice. Nothing contained herein constitutes financial, legal, tax, or other advice. The appropriateness of an investment or strategy will depend on an investor’s circumstances and objectives. These opinions may not fit to your financial status, risk and return preferences. Investment recommendations may change, and readers are urged to check with their investment advisors before making any investment decisions. Information provided is based on public information, by sources believed to be reliable but we cannot attest to its accuracy. Estimates of future performance are based on assumptions that may not be realized. Past performance is not necessarily indicative of future returns. The following indexes were used as proxies in the performance tables: Global Stocks = MSCI ACWI; U.S. Large Cap = S&P 500; U.S. Large Value = Russell 1000 Value; U.S. Large Growth = Russell 1000 Growth; U.S. Small Cap = Russell 2000; Int’l Dev Stocks = MSCI EAFE; Emerging Markets = MSCI EM; U.S. Inv Grade Bonds = Barclays U.S. Aggregate; U.S. High Yield Bonds = Barclays Corporate High Yield; Emerging Markets Debt = JPMorgan EMBI Global Diversified; Int’l Bonds = Barclays Global Treasury ex US; Cash = 3month T-Bill; Sector returns displayed in the chart represent S&P 500 sectors, while treasury benchmarks are from Barclays
Source: Schwab Center for Financial Research with data provided by Morningstar, Inc., as of 3/31/2022. Asset class performance represented by annual total returns for the following indexes: S&P 500® Index (US Lg Cap), Russell 2000® Index (US Sm Cap), MSCI EAFE® Net of Taxes (Int’l Dev), MSCI Emerging Markets IndexSM (EM), MSCI US REIT Index (REITs), S&P GSCI® (Comm.), Bloomberg Barclays U.S. Treasury Inflation-Linked Bond Index (TIPS), Bloomberg Barclays U.S. Aggregate Bond Index (Core US Bonds), Bloomberg Barclays U.S. High Yield Bond Index (High Yield Bonds), Bloomberg Barclays Global Aggregate Ex-USD TR Index (Int’l Dev Bonds), Bloomberg Barclays Emerging Markets USD Bond TR Index (EM Bonds), FTSE U.S. 3-Month T-Bill Index (T-Bills). Past results are not an indication or guarantee of future performance. Returns assume reinvestment of dividends, interest, and capital gains. Indexes are unmanaged, do not incur fees or expenses, and cannot be invested in directly.
Chart of the Month: Strategas
Chart of the Month
Quote of the Month
“Skepticism and pessimism aren’t synonymous. Skepticism calls for pessimism when optimism is excessive. But it also calls for optimism when pessimism is excessive.”
Howard Marks – American Investor and Co-founder of Oaktree Capital Management
Trailing Returns