Market Perspectives April 2024
Capital Markets
By: Wade Austin
March 2024 saw a continuation of the strong equity rally that began in late 2023 and continued volatility in the bond market. Here’s a breakdown of the key themes:
Equity Markets:
- The S&P 500 gained another 3.2% in March, its fifth consecutive monthly gain. The rally wasn’t just limited to large-cap stocks like in previous months. Mid-cap and small-cap stocks, typically more sensitive to economic conditions, also saw significant gains, with the Russell 2000 Index rising 3.6%. Developed international stocks rallied 3.3%, outpacing U.S. stocks in March, while emerging market stocks advanced 2.6%.
- With stocks broadly expressing optimism that inflation will continue to moderate and economic growth will be sustained without a recession, the major indexes have enjoyed unusually smooth sailing to start the year. In Q1, the Dow Industrials rose 6.1% and the NASDAQ 9.3%. The S&P 500’s 10.6% quarterly gain was its best since 2019 and its 14th best in history. It reached an all-time high 22 times in Q1.
- Perhaps more remarkably, measures of downside volatility were near historic lows. If held for the remainder of the year, the S&P 500’s maximum drawdown of -1.7% would be the smallest on record. The best full-year maximum drawdown was -2.5% in 1995.
- For the second consecutive month, all 11 major sectors comprising the S&P 500 registered gains last month. Energy (+10.6%), Utilities (+6.6%) and Materials (+6.5%) led, while Consumer Discretionary (+0.1%) and Technology (+0.8%) showed signs of fatigue after months of leadership. The market experienced broader participation in March. Value stocks (+5.0%) outpaced growth (1.8%), although growth stocks maintained their advantage for the quarter (+11.4% vs. +9.0%).
Bond Markets:
- S. bonds broke a two-month losing streak in March, as the Bloomberg U.S. Aggregate Bond Index climbed +0.92%. However, the monthly gain was insufficient to offset prior declines, resulting in a -0.8% quarterly return.
- The 10-year U.S. Treasury Note yield closed March at 4.2%, a modest 5 bps lower than Feb. 29 but 32 bps higher than Dec. 31. At the start of the year, the market anticipated five or six rate cuts in 2024. As inflation proved stickier than expected, those expectations have been slashed to only one or two cuts.
- In an environment where yields backed up and economic growth proved resilient, credit spreads tightened for the quarter. As a result, less rate-sensitive U.S. investment-grade corporate bonds outperformed Treasurys. Riskier high-yield corporate bonds were the top-performing fixed income sector, posting a +1.5% total return.
- Municipal bonds were flat in March but outperformed Treasurys for the quarter (-0.4% vs. -1.0%).
Key Takeaways:
- March marked five consecutive months of gains, a 99th-percentile occurrence. When the outlook for corporate earnings and economic growth is bright, markets more often than not respond positively.
- Helping fuel the rally since the October 2022 lows has been optimism surrounding the emergence of two secular themes: generative artificial intelligence and healthcare innovation. So far, the shovel makers of the AI gold rush (semiconductors, hardware enablers, and software enablers) have been the big winners. Nvidia, the most golden shovel supplier, gained 82% during Q1. Further, the beneficiaries of innovative use cases of GenAI technology will expand over time. Early adopters in fields such as information processing, professional services and financial services have reported average productivity gains of 25%! Meanwhile, initial forecasts for the GLP-1 market, driven by diabetes and obesity usage, suggest even more explosive growth prospects within biotech and pharmaceutical industry groups.
- Speaking of gold rushes, the yellow metal is trading at a 5,000-year record high, climbing above $2,300. Copper and other industrial metals have also experienced explosive strength, reflecting an improving global economy and concerns about the mounting U.S. debt.
- The market remains fixated on the timing of the Fed’s first rate cut, with the current debate focused on June or July. However, the big picture for investors remains that the Fed’s next move will be a cut, not a raise.
Reflections:
- Assessing risks to the investment landscape is a prudent routine during rallies like the present. Geopolitical risks appear elevated, but their impacts are always tricky to predict. In a presidential election year, a clean sweep by either party would likely rattle markets. However, sentiment and valuations pose the most likely challenge to market momentum in the near term. With the expectations bar set high, the stock price of any company missing their earnings target or offering disappointing guidance during the coming weeks’ earnings season could be punished harshly. And with elevated valuations at the overall index level, markets could easily take a breather.
- On one hand, it’s a concern that hot, momentum market areas, such as technology stocks, displayed signs of fatigue in March. Yet, other sectors showing new signs of life (such as energy, financials and materials) signify a healthy market.
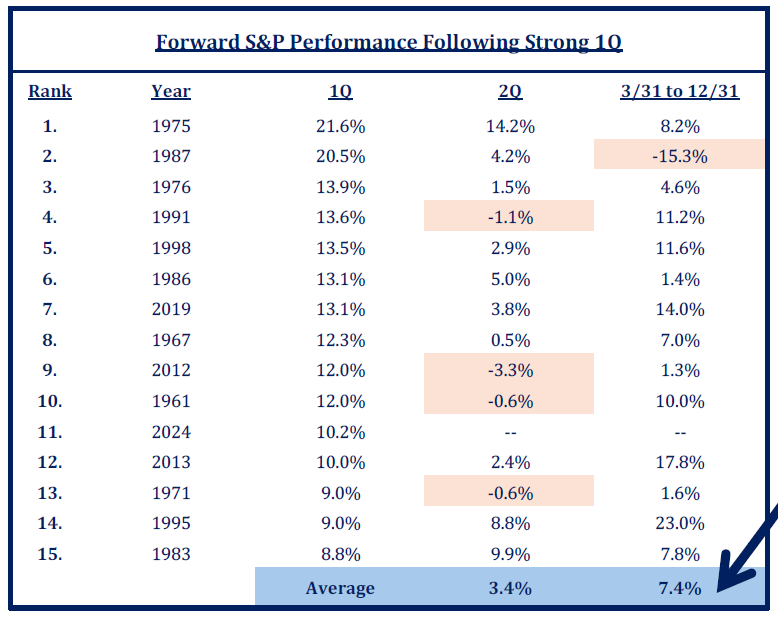
- Historically, a strong Q1 bodes well for the rest of the year. Our Chart of the Month ranks Q1 2024 as the S&P 500’s 11th-best start since 1950. After the other top 14 starts to a year, the average performance for Q2 was 3.4% and 7.4% for the remainder of the year. More significantly, the index declined only once over the rest of the year—1987.
- Quarterly returns of 10% are not sustainable, and corrections can occur anytime. However, any Q2 pullbacks have been only minor speed bumps, and the probabilities for the 9-month path ahead are skewed substantially favorably.
Insights by John Silvia, Director of Economics

Three economic factors have set a positive tone for equity markets since the beginning of the year. Better-than-expected economic growth is the dominant factor. Meanwhile, persistent inflation at a pace above the Fed’s target of 2% has disappointed investors. Third, the combination of better-than-expected economic growth and persistent inflation has limited market expectations for the number of interest rate cuts by the Fed.
- Recession forecasts have disappeared. Leading indicators such as jobless claims, consumer sentiment and durable goods orders signal continued growth ahead.
- Strength in the job market has set the tone for trend plus growth in the economy. As of March, job gains have averaged 212,000, which is stronger than the pace of 189,000 over the last 12 months.
- Meanwhile, average hourly earnings rose 4.1% over the last three months, on a steady course with a gain of 4.1 over the previous year. This combination of job and wage gains led to real household income gains, thereby stronger consumer demand. Real personal consumer expenditures are up 2.7% over the last three months compared to 2.4% over the previous year.
- Consumer sentiment in March was above the levels of three months ago. The current assessment of the economy and expectations for the future rose over that same period.
- For business, nondefense capital goods orders, such as ex-aircraft and shipments in February, were above the levels at the start of Q4. Another positive sign was that the inventory-to-shipments ratio declined. This signals a better balance for inventories going forward.
- In the last three months of 2023, economic growth was reported to be up 3.4%, with contributions from consumer spending, business investment, government spending and net exports. This balance of contributions enhances the positive economic outlook going forward.
- Inflation, the second fundamental, continues to moderate compared to a year ago, but the pace is not as swift as the markets had discounted. The Fed’s benchmark inflation measure, core PCE, has slowed year over year. However, this measure of core inflation has quickened to 3.5% over the last three months.
- Slower inflation removes the expectation for the Fed to raise rates, which has been a plus for both equity and bond markets. However, expectations for any Fed easing in the first half of the year have sharply declined since the current year-over-year inflation pace of 2.8% remains far above the Fed’s 2% target.
- Adding to inflation concerns, average hourly earnings rose 4.1% over a year ago for the March data. The Fed uses this indicator as a benchmark for gauging future inflation prospects. Therefore, this suggests caution on the extent of Fed easing already priced into financial assets. Is the economy too good and the labor market too strong to allow an easing of monetary policy currently? Yes. Any easing in May is unlikely, and June is a toss-up bet at this time.
- For a leading indicator of inflation, we track the Federal Reserve Bank of Dallas trimmed mean PCE Deflator. Trimmed mean is the result of cutting out the top increases and bottom decreases each month. The current trimmed mean is 3.13 %. This series has not moved down in recent months. Above-trend economic growth and sticky inflation are not a recipe for the Fed to lower interest rates.
- The FOMC continues to signal their data dependence. Current data would not alter Chairman Powell’s view that “policy will remain at a restrictive stance for some time until inflation was moving sustainably toward the Committee’s objective.”
- We expect that the Fed will not lower the funds rate until the June meeting at the earliest.
- Gains in economic growth expectations and no immediate Fed rate cuts have supported the U.S. dollar’s appreciation so far this year.
- Expectations for economic growth in Europe, the U.K., and Canada are below 1% for the year ahead.
Quote of the Month
“Closely following daily fluctuations is a losing proposition, because the pain of the frequent small losses exceeds the pleasure of the equally frequent small gains. Once a quarter is enough for individual investors. In addition to improving the emotional quality of life, the deliberate avoidance of exposure to short-term outcomes improves the quality of both decisions and outcomes.”
Daniel Kahneman – Israeli-American Author and Nobel Prize-winning Behavioral Economist
Chart of the Month
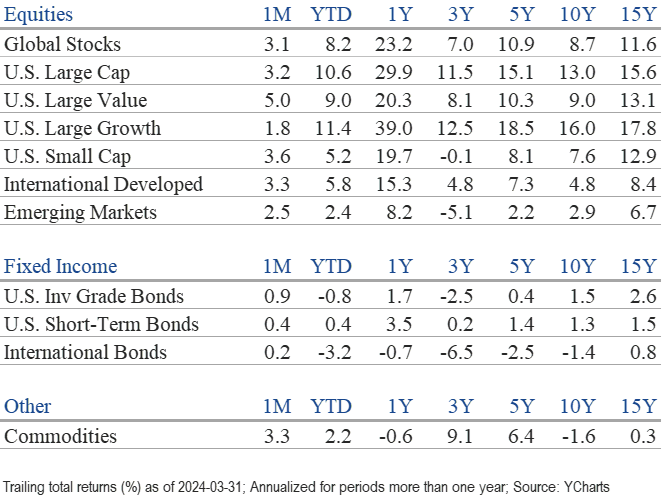
The information published herein is provided for informational purposes only, and does not constitute an offer, solicitation or recommendation to sell or an offer to buy securities, investment products or investment advisory services. All information, views, opinions and estimates are subject to change or correction without notice. Nothing contained herein constitutes financial, legal, tax, or other advice. The appropriateness of an investment or strategy will depend on an investor’s circumstances and objectives. These opinions may not fit to your financial status, risk and return preferences. Investment recommendations may change, and readers are urged to check with their investment advisors before making any investment decisions. Information provided is based on public information, by sources believed to be reliable but we cannot attest to its accuracy. Estimates of future performance are based on assumptions that may not be realized. Past performance is not necessarily indicative of future returns. The following indexes were used as proxies in the performance tables: Global Stocks = MSCI ACWI; U.S. Large Cap = S&P 500; U.S. Large Value = Russell 1000 Value; U.S. Large Growth = Russell 1000 Growth; U.S. Small Cap = Russell 2000; Int’l Dev Stocks = MSCI EAFE; Emerging Markets = MSCI EM; U.S. Inv Grade Bonds = Barclays U.S. Aggregate; U.S. High Yield Bonds = Barclays Corporate High Yield; Emerging Markets Debt = JPMorgan EMBI Global Diversified; Int’l Bonds = Barclays Global Treasury ex US; Cash = 3month T-Bill; Sector returns displayed in the chart represent S&P 500 sectors, while treasury benchmarks are from Barclays
Source: Schwab Center for Financial Research with data provided by Morningstar, Inc., as of 3/31/2022. Asset class performance represented by annual total returns for the following indexes: S&P 500® Index (US Lg Cap), Russell 2000® Index (US Sm Cap), MSCI EAFE® Net of Taxes (Int’l Dev), MSCI Emerging Markets IndexSM (EM), MSCI US REIT Index (REITs), S&P GSCI® (Comm.), Bloomberg Barclays U.S. Treasury Inflation-Linked Bond Index (TIPS), Bloomberg Barclays U.S. Aggregate Bond Index (Core US Bonds), Bloomberg Barclays U.S. High Yield Bond Index (High Yield Bonds), Bloomberg Barclays Global Aggregate Ex-USD TR Index (Int’l Dev Bonds), Bloomberg Barclays Emerging Markets USD Bond TR Index (EM Bonds), FTSE U.S. 3-Month T-Bill Index (T-Bills). Past results are not an indication or guarantee of future performance. Returns assume reinvestment of dividends, interest, and capital gains. Indexes are unmanaged, do not incur fees or expenses, and cannot be invested in directly.
Chart of the Month: Strategas
Chart of the Month
Quote of the Month
“Closely following daily fluctuations is a losing proposition, because the pain of the frequent small losses exceeds the pleasure of the equally frequent small gains. Once a quarter is enough for individual investors. In addition to improving the emotional quality of life, the deliberate avoidance of exposure to short-term outcomes improves the quality of both decisions and outcomes.”
Daniel Kahneman – Israeli-American Author and Nobel Prize-winning Behavioral Economist
Trailing Returns