Market Perspectives May 2024
Capital Markets
By: Wade Austin
After a strong start to the year, April saw a significant shift in capital markets. Here’s a breakdown of the key themes:
Equity Markets:
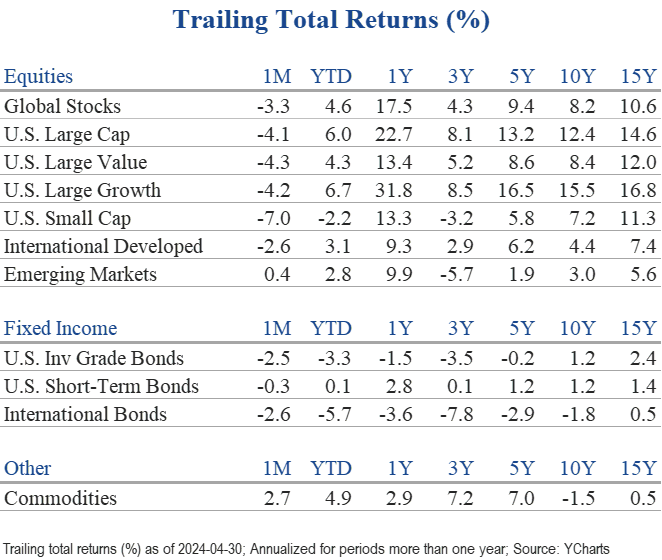
- U.S. and global indexes snapped a five-month winning streak in April, with the S&P 500 and tech-heavy NASDAQ falling 4.1% and 4.4%, respectively. The Dow Jones Industrial Average fared slightly worse, dropping 5%. Developed international stocks declined 2.6%, less than U.S. stocks.
- Emerging markets were the month’s outlier, posting a small gain of 0.5%. Higher commodity exposure and investor interest in depressed Chinese equities were the primary drivers. On a country basis, China was April’s top performer, gaining 6.6%, while India rose 2.3%. Japan (-4.9%) and Brazil (-4.1%) joined the U.S. as global laggards for the month.
- Utilities were the only positive sector, while interest rate-sensitive areas like Real Estate, Technology, and Healthcare suffered the most, dropping over 5%. Small-cap stocks, another interest rate-sensitive asset class, substantially underperformed compared to large-caps.
- The Magnificent 7 companies continue to flex their muscles, as evidenced by mostly strong Q1 earnings reports. Among the S&P 500 constituents, Amazon, Google, Meta, Microsoft, and Nvidia are collectively tracking toward Q1 earnings growth of 64% compared to approximately 1% for the other 495. Meta and Google recently announced they will start paying dividends, joining other Mag 7 members: Apple (1987), Microsoft (2003), and Nvidia (2012). Tesla isn’t financially positioned to offer a dividend, but Amazon could soon become the sixth mega-cap growth stock to announce a dividend.
- Investors’ apprehension in April was due to a combination of factors: sticky inflation, rising interest rates, and geopolitical tensions. Despite the 4%+ pullback, global equities remain on track for a solid year, up 4.6% and led by the S&P 500’s 6.7% YTD gain.
Bond Markets:
- Rising inflation data fueled markets’ recalibration for the timing of expected interest rate cuts by central banks. Speculation arose that the next Fed move might be a raise instead of a cut. This heightened anxiety led to a selloff in bond markets, with the U.S. Bloomberg Aggregate Index falling 2.5%. All fixed income sectors declined.
- Both short-term (2-year) and long-term (10-year) U.S. Treasury yields soared and remained inverted. The 10-year note climbed 48 bps to 4.69%, while the 2-year yield jumped 42 bps to 5.05%.
- Municipal bonds also declined but outperformed Treasurys for the quarter (-1.24% vs. -2.33%).
- Credit spreads remained calm and showed no signs of stress. High-yield corporate bonds declined a modest 0.9% but outperformed investment-grade corporates. Historically, high-yield spreads have been the “canary in the coal mine” in signaling when markets begin to anticipate significant deterioration in the economy’s health.
Key Takeaways:
- The S&P 500’s recent -5.4% pullback is ordinary and shouldn’t be alarming, especially on the heels of a five-month winning streak. The S&P 500 averages three 5% or more significant pullbacks every year. Despite an average maximum intra-year drawdown of -14.2%, the annual returns were positive in 33 of the last 44 years.
- The Bloomberg Commodities Index was the month’s top-performing asset class, rising 2.7%. The gains were sparked by both positive and negative factors—mainly a resilient economy and geopolitical tensions in the Middle East. Copper, a leading economic indicator, rose 13.7% in April.
- Bond sentiment turned bearish again as inflation data prompted renewed expectations for “higher for longer” interest rates. Yet when the view becomes too consensus, markets tend to surprise in the other direction. Time will tell if last week’s 4.7% yield for the 10-year Treasury marks a near-term peak.
- With 80% of companies reported, S&P 500 Q1 operating earnings are up 5% over the past year, the fifth consecutive quarter of positive YoY growth. Further, 77% of companies beat analysts’ earnings estimates. Higher-than-expected productivity growth rates boosted by gen AI innovations have been a significant catalyst as trailing operating earnings approach another record high.
Reflections:
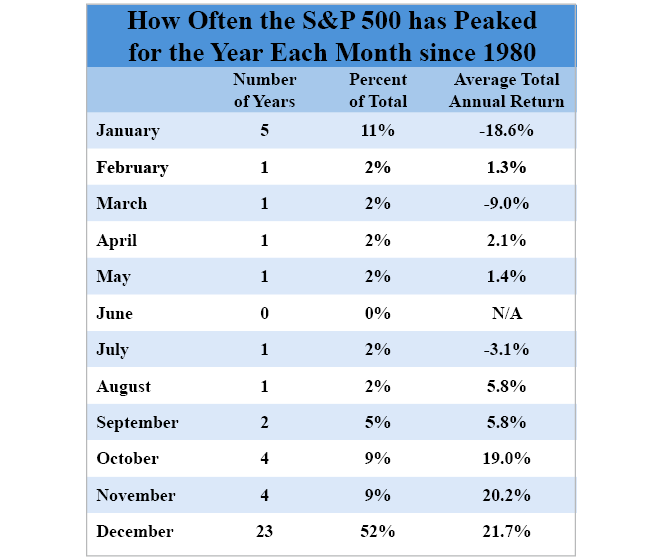
- The S&P’s most recent all-time closing high was 5,254 on March 28. During April’s pullback, a popular question arose: Was late March the top for the stock market this year? Of course, we don’t have a crystal ball, but we don’t believe so based on several historical data points.
- Our Chart of the Month reveals that since 1980, the S&P 500 peaked in March only once. In favorable years, the stock market usually peaks in Q4. The top in bad years typically occurs in January. With 81% of all tops occurring in either January or Q4, it’s rare to peak between February and September. It would likely take a powerful catalyst, such as a geopolitical event or Fed policy mistake, to not reclaim 5,254 this year.
- The current bull market has gained 43% and is extremely young at 18 months old. This bull would be the quickest and weakest on record if it were to end now. The average bull market lasts nearly five years and gains over 150%.
- The familiar Wall Street adage “sell in May and go away” is at best a misnomer. While June through October has historically been a weaker part of the calendar, not being invested the five months after May meant missing out on positive returns in most years. When entering May in an uptrend, as is the case this year, the following three months have actually produced above-average returns.
- Statistically, a more accurate seasonal guide would be “say goodbye in July,” which held true last year. However, history suggests it won’t repeat in 2024. August through October has been an especially strong period during Presidential re-election years.
Insights by John Silvia, Director of Economics

Expectations for growth, inflation, and interest rates have turned in favor of investors. Overheated economic numbers have moderated. Inflation concerns declined, and fear of a Federal Reserve rate increase evaporated. The result is that our three economic factors have now set a positive tone for equity markets.
- For the economy, recession forecasts have disappeared. Leading indicators such as jobless claims, consumer sentiment, and durable goods orders signal continued growth ahead but at a more moderate pace than in Q1.
- Job market gains have moderated. April private sector job gains were 167K, below the three-month average of 197K. The unemployment rate rose to 3.9% from 3.7% three months ago.
- Meanwhile, average hourly earnings rose 2.8% over the last three months compared to a gain of 3.9% over the previous 12 months. This combination of job and wage gains still supports real household income gains but at a more moderate pace than in Q1. Real personal consumer expenditures slowed to 2.7% over the last three months, compared to 3.1% over the previous year. Service spending was strong at 3.9% over the last three months. Slower-but-positive growth is a good sign for expecting a reduction in the Fed’s policy rate later this year.
- Consumer sentiment in April also moderated. The overall index, as well as the current assessment of the economy and expectations for the economy, declined relative to three months ago.
- Moderation also characterized the growth of nondefense capital goods orders, such as ex-aircraft and shipments, in March. Unfilled orders declined in March relative to January, which is a positive signal that supply chain delays are declining.
- For all of 2024, we expect 2.3% economic growth with positive contributions from consumer spending, business investment, and government.
- Inflation, the second fundamental, has not moderated as swiftly as the markets had discounted. The Fed’s benchmark inflation measure, core PCE, rose 4.4% over the last three months compared to a year-over-year gain of 2.8%.
- This higher rate of recent inflation has diminished the number and pace of Fed-easing moves this year. Expectations for any Fed easing in the first half of the year have sharply declined since the current year-over-year inflation of 2.8% remains far above the Fed’s 2% target. Market expectations favor no rate cuts by the Fed in June or July.
- April increases in both the ISM manufacturing and service sector prices paid above the Q4 averages add to inflation concerns. April’s average hourly earnings rose 4% over a year ago. This pace adds caution to the Fed’s inflation outlook as it is too rapid for a sustained 2% inflation target.
- Two leading inflation indicators signal caution on expectations for Fed easing. The Federal Reserve Bank of Dallas Trimmed Mean PCE deflator of 3.04% for March is significantly above the 2% inflation target. Second, the price pressures measure published by the St. Louis Fed assigns a better than 90% probability that the PCE deflator will be above 2.5% a year from now. These two measures corroborate the view of limited Fed easing in the year ahead.
- The FOMC continues to signal their data dependence. Current data should not alter Chairman Powell’s view that “policy will remain at a restrictive stance for some time until inflation was moving down sustainably toward the Committee’s objective.”
- We expect that the Fed will not lower the funds rate until the September meeting at the earliest.
- Profits have been the biggest positive surprise for investors. Pre-tax corporate profits bottomed out in Q4 2022 and are up 9.1% year-over-year. Strength in real final sales and improved productivity that has lowered unit labor costs have boosted profits above market expectations.
- The baseline outlook for interest rates remains sustained, higher long-run Treasury market interest rates compared to the decade of 2012-2019.
- As for the U.S. dollar, gains in economic growth expectations and no immediate Fed rate cuts have supported its appreciation so far this year relative to the euro, yen, and British pound.
- One central theme in our outlook remains: U.S. financial markets continue to adjust to the economic reality of better-than-expected economic growth, higher-for-longer interest rates, and recently improved profit expectations. These factors support a more positive but cautious view of financial asset valuations relative to the challenges of 2022 and spring 2023.
- Expectations for economic growth in Europe, the U.K., and Canada are all below 1% for the year ahead. Stronger capital inflows to the U.S. have boosted the dollar, increased equity valuations, and limited the rise in Treasury interest rates.
Quote of the Month
“It is remarkable how much long-term advantage people like us have gotten by trying to be consistently not stupid, instead of trying to be very intelligent.”
— Charlie Munger, legendary American businessman, investor, and philanthropist
Chart of the Month
The information published herein is provided for informational purposes only, and does not constitute an offer, solicitation or recommendation to sell or an offer to buy securities, investment products or investment advisory services. All information, views, opinions and estimates are subject to change or correction without notice. Nothing contained herein constitutes financial, legal, tax, or other advice. The appropriateness of an investment or strategy will depend on an investor’s circumstances and objectives. These opinions may not fit to your financial status, risk and return preferences. Investment recommendations may change, and readers are urged to check with their investment advisors before making any investment decisions. Information provided is based on public information, by sources believed to be reliable but we cannot attest to its accuracy. Estimates of future performance are based on assumptions that may not be realized. Past performance is not necessarily indicative of future returns. The following indexes were used as proxies in the performance tables: Global Stocks = MSCI ACWI; U.S. Large Cap = S&P 500; U.S. Large Value = Russell 1000 Value; U.S. Large Growth = Russell 1000 Growth; U.S. Small Cap = Russell 2000; Int’l Dev Stocks = MSCI EAFE; Emerging Markets = MSCI EM; U.S. Inv Grade Bonds = Barclays U.S. Aggregate; U.S. High Yield Bonds = Barclays Corporate High Yield; Emerging Markets Debt = JPMorgan EMBI Global Diversified; Int’l Bonds = Barclays Global Treasury ex US; Cash = 3month T-Bill; Sector returns displayed in the chart represent S&P 500 sectors, while treasury benchmarks are from Barclays
Source: Schwab Center for Financial Research with data provided by Morningstar, Inc., as of 3/31/2022. Asset class performance represented by annual total returns for the following indexes: S&P 500® Index (US Lg Cap), Russell 2000® Index (US Sm Cap), MSCI EAFE® Net of Taxes (Int’l Dev), MSCI Emerging Markets IndexSM (EM), MSCI US REIT Index (REITs), S&P GSCI® (Comm.), Bloomberg Barclays U.S. Treasury Inflation-Linked Bond Index (TIPS), Bloomberg Barclays U.S. Aggregate Bond Index (Core US Bonds), Bloomberg Barclays U.S. High Yield Bond Index (High Yield Bonds), Bloomberg Barclays Global Aggregate Ex-USD TR Index (Int’l Dev Bonds), Bloomberg Barclays Emerging Markets USD Bond TR Index (EM Bonds), FTSE U.S. 3-Month T-Bill Index (T-Bills). Past results are not an indication or guarantee of future performance. Returns assume reinvestment of dividends, interest, and capital gains. Indexes are unmanaged, do not incur fees or expenses, and cannot be invested in directly.
Chart of the Month: DataTrek
Chart of the Month
Quote of the Month
“It is remarkable how much long-term advantage people like us have gotten by trying to be consistently not stupid, instead of trying to be very intelligent.”
— Charlie Munger, legendary American businessman, investor, and philanthropist
Trailing Returns