Market Perspectives September 2021
Capital Markets
By: Wade Austin
Despite worries emanating from surging Delta variant cases and the associated sharp drop in consumer sentiment, investors focused on the positives in August, spurring the S&P 500 3% higher and to its 6th best August YTD performance since 1950. The S&P 500 reached record highs 12 times in August alone and 53 times YTD.
Late July through early September has been the softest stretch of the calendar historically, but a blowout Q2 earnings season proved to be a catalyst for global stocks this Summer. Final S&P 500 results for corporate earnings growth (+95%) and revenue growth (+24.6%) exceeded analysts’ July 1st estimates by a massive 29 and 6 percentage points, respectively.
In August, emerging markets and international stocks also posted solid gains amid improving economic reports and corporate earnings growth that surpassed expectations. The Chinese government’s regulatory crackdown on its own technology companies spooked investors. It sparked a selloff, but European and Latin American countries’ robust performance lifted the broad EM index higher. India and Russia’s equity indexes have gained 25.6% and 23.3% YTD while China’s has declined 12.3%.
Global central bank’s zero and negative interest rate policies continue to support equity markets with even greater impact during the current period of rising inflation as real interest rates fall further negative. As elevated inflation remains “sticky,” investors have been focused on the Fed’s timing for their eventual tapering of bond purchases. The most recent softer economic data reports (see John Silvia’s economic insights) provide a silver lining for equity investors speculating that the Fed is more likely to delay tapering until 2022.
As we’ve described in recent editions, breadth in the U.S. stock market has waned since May. Large-cap stocks are outperforming small caps by 3.8 percentage points QTD. Despite their gargantuan size, lofty valuations, and regulatory concerns, five mega-cap technology stocks (Apple, Microsoft, Google, Amazon, and Facebook) are driving the broad indexes higher. Unlike last year’s COVID rally, the smaller “stay-at-home” growth stocks have not kept pace this year. Investors have favored the tech giants’ quality and stability of earnings during the Delta surge. The “FANG” stocks have notably outperformed traditional defensive sectors such as staples during 70% of the down markets since 2012.
As the economic backdrop and corporate fundamentals remain strong, and with data suggesting Delta may be peaking nationally, the primary trend for equities still appears higher. In the face of inflation concerns, supply chain issues, and weak economic data from China, we’re mindful the S&P 500 has doubled over the past 17 months without a correction.
While the NFL season kicks off this weekend, the House and Senate are game-planning for their Super Bowl. The legislative calendar takes center stage over the next two months with action on infrastructure, Biden’s $3.5T spending package, budget reconciliation, fiscal cliff, debt ceiling, Biden’s tax increase proposals, and Fed reappointments.
Individually, much less collectively, the scope and scale of these packages are massive. Biden’s proposed spending package is the largest in over 100 years and would be financed by the largest tax increase in over 50 years. Its health care bill is bigger than Obamacare, and its energy bill is the largest of our lifetime.
These policy decisions are coming fast with kickoff as soon as next week. We expect the debate and rhetoric to be contentious, and headlines may not be viewed as market friendly.
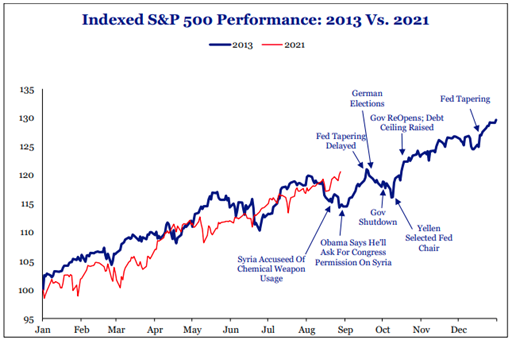
2013 perhaps offers a guide for what to expect when Congress previously faced a confluence of significant legislative issues during a healthy stock market. Our Chart of the Month plots the timeline of 2013’s major policy actions against the S&P 500’s performance. In 2013, the S&P 500 entered September up 16% YTD. The index endured a bout of volatility during the legislative drama but emerged on another upswing finishing the year up 32%.
Insights by John Silvia, Director of Economics

- For some observers, the August employment report appeared disappointing. However, three points are worth noting.
- The August job gains are traditionally the weakest gains of the year as many employers/workers are on vacation.
- Initial jobless claims, the leading indicator of the jobs market, continues to decline.
- Finally, this week’s job openings report showed a record number of job openings. The demand side of the labor market is very strong.
- Good news from the leading economic indicators, such as jobless claims and factory orders/shipments, indicate continued positive economic growth above the 2% long-run trend for the rest of the year. Building permits have slowed and are consistent with the rising housing affordability problem.
- 2021 FY economic growth is expected to be 6%+ with healthy consumer spending, residential investment, and business investment gains. Inflation rates have risen over the past year and are expected to present some challenges to investors as real returns on cash and sovereign debt continue to be negative.
- Benchmark Treasury yields reached a 6-month low in early August as statements from Federal Reserve policymakers have emphasized patience concerning any reduction in Fed bond purchases. Meanwhile, Treasury debt issuance is expected to decline relative to a year ago, thereby further limiting any rise of interest rates despite greater than expected inflation.
- As consistent with Fed policy intentions, we expect that rising inflation and benchmark interest rates along with a steady decline in the U.S. dollar value promotes caution in the outlook for fixed income financial assets. In the very recent past, yields have declined, but the longer-run view, consistent with Fed intentions, is for higher interest rates and inflation. Still, real returns are often negative after inflation and taxes.
- Even within an economic expansion, there are periods of accelerating and decelerating growth/inflation benchmarks that can distract from the long-run goals of investors. Investment opportunities and risks change as the economic recovery evolves, often due to changes in many economic and policy factors. In addition, a new political administration has introduced new priorities regarding taxes, energy development, and infrastructure. All of these require further review of your portfolio.
Quote of the Month
“If you want to have better performance than the crowd, you must do things differently from the crowd.”
Sir John Templeton
Chart of the Month
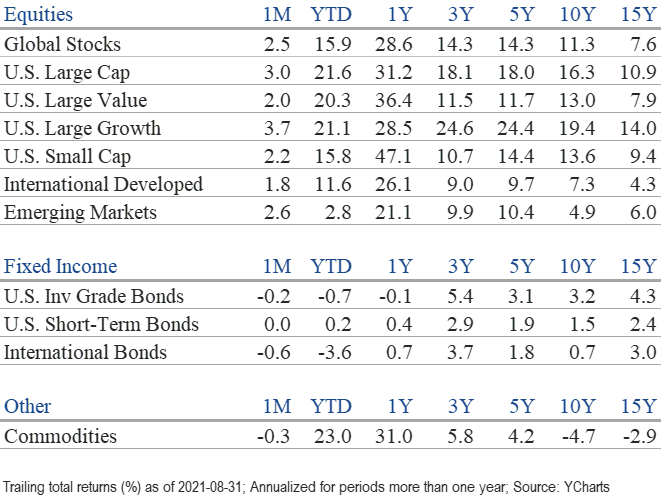
The information published herein is provided for informational purposes only, and does not constitute an offer, solicitation or recommendation to sell or an offer to buy securities, investment products or investment advisory services. All information, views, opinions and estimates are subject to change or correction without notice. Nothing contained herein constitutes financial, legal, tax, or other advice. The appropriateness of an investment or strategy will depend on an investor’s circumstances and objectives. These opinions may not fit to your financial status, risk and return preferences. Investment recommendations may change, and readers are urged to check with their investment advisors before making any investment decisions. Information provided is based on public information, by sources believed to be reliable but we cannot attest to its accuracy. Estimates of future performance are based on assumptions that may not be realized. Past performance is not necessarily indicative of future returns. The following indexes were used as proxies in the performance tables: Global Stocks = MSCI ACWI; U.S. Large Cap = S&P 500; U.S. Large Value = Russell 1000 Value; U.S. Large Growth = Russell 1000 Growth; U.S. Small Cap = Russell 2000; Int’l Dev Stocks = MSCI EAFE; Emerging Markets = MSCI EM; U.S. Inv Grade Bonds = Barclays U.S. Aggregate; U.S. High Yield Bonds = Barclays Corporate High Yield; Emerging Markets Debt = JPMorgan EMBI Global Diversified; Int’l Bonds = Barclays Global Treasury ex US; Cash = 3month T-Bill; Sector returns displayed in the chart represent S&P 500 sectors, while treasury benchmarks are from Barclays
Chart of the Month Source: Strategas
Chart of the Month
Quote of the Month
“If you want to have better performance than the crowd, you must do things differently from the crowd.”
Sir John Templeton
Trailing Returns