Market Perspectives October 2021
Capital Markets
By: Wade Austin
The global stock rally stalled in September as accumulating headwinds weighed on markets. U.S. stocks were overdue for a pause, having risen seven consecutive months. Mounting inflation, intensifying supply chain disruptions and bottlenecks, hawkish statements from the Federal Reserve and central banks worldwide, escalating tensions with signs of gridlock in Washington, fluctuating Covid cases, and a potential collapsing of China’s second-largest real estate developer top the list of catalysts.
After reaching an all-time high on September 2nd, the S&P 500 retreated 5.1% by month-end. Its -4.6% total return marked the worst monthly loss since the pandemic’s emergence and was the first monthly decline since January. For the third quarter, the U.S. large-cap equity benchmark index eked out a fractional +0.6% gain.
Despite September’s pullback and a flat Q3, the S&P 500 posted an impressive +15.9% YTD total return with all eleven equity sectors gaining ground. Energy stocks are having their best year in four decades and were the lone winner in September (+9.4%) as oil prices reached 3-year highs. Materials were the laggard (-7.2%). If something more sinister were brewing, we would expect the traditionally defensive sectors (Utilities (-6.2%) and Staples (-4.1%)) to outperform. They did not.
International developed markets (-2.9%) and emerging markets (-4.0%) posted similar declines as the U.S. in September, but these overseas markets declined during Q3 (-0.5%) and (-8.01%) respectively. Due to regulatory crackdowns and Evergrande’s troubles, a selloff in China pushed the broad emerging market index into negative territory YTD (-1.3%). Chinese companies comprise 30% of the EM benchmark equity index.
The mildly hawkish Fed comments during its September meeting pressured bond yields. In response to elevated inflation data (5.3% annualized in August), the Fed hinted it would likely begin tapering its bond purchases before year-end. 10-year Treasury note yields ended September at 1.49%, up 18 basis points (bps) for the month, and has since marched above 1.6%. The broad U.S. aggregate bond index declined (-0.87%) for the month, was flat for the quarter, and remained negative YTD (-1.6%). The returns on all significant bond segments were negative in September, but TIPS (+1.8%) and high yield corporates (+0.9%) gained ground during Q3.
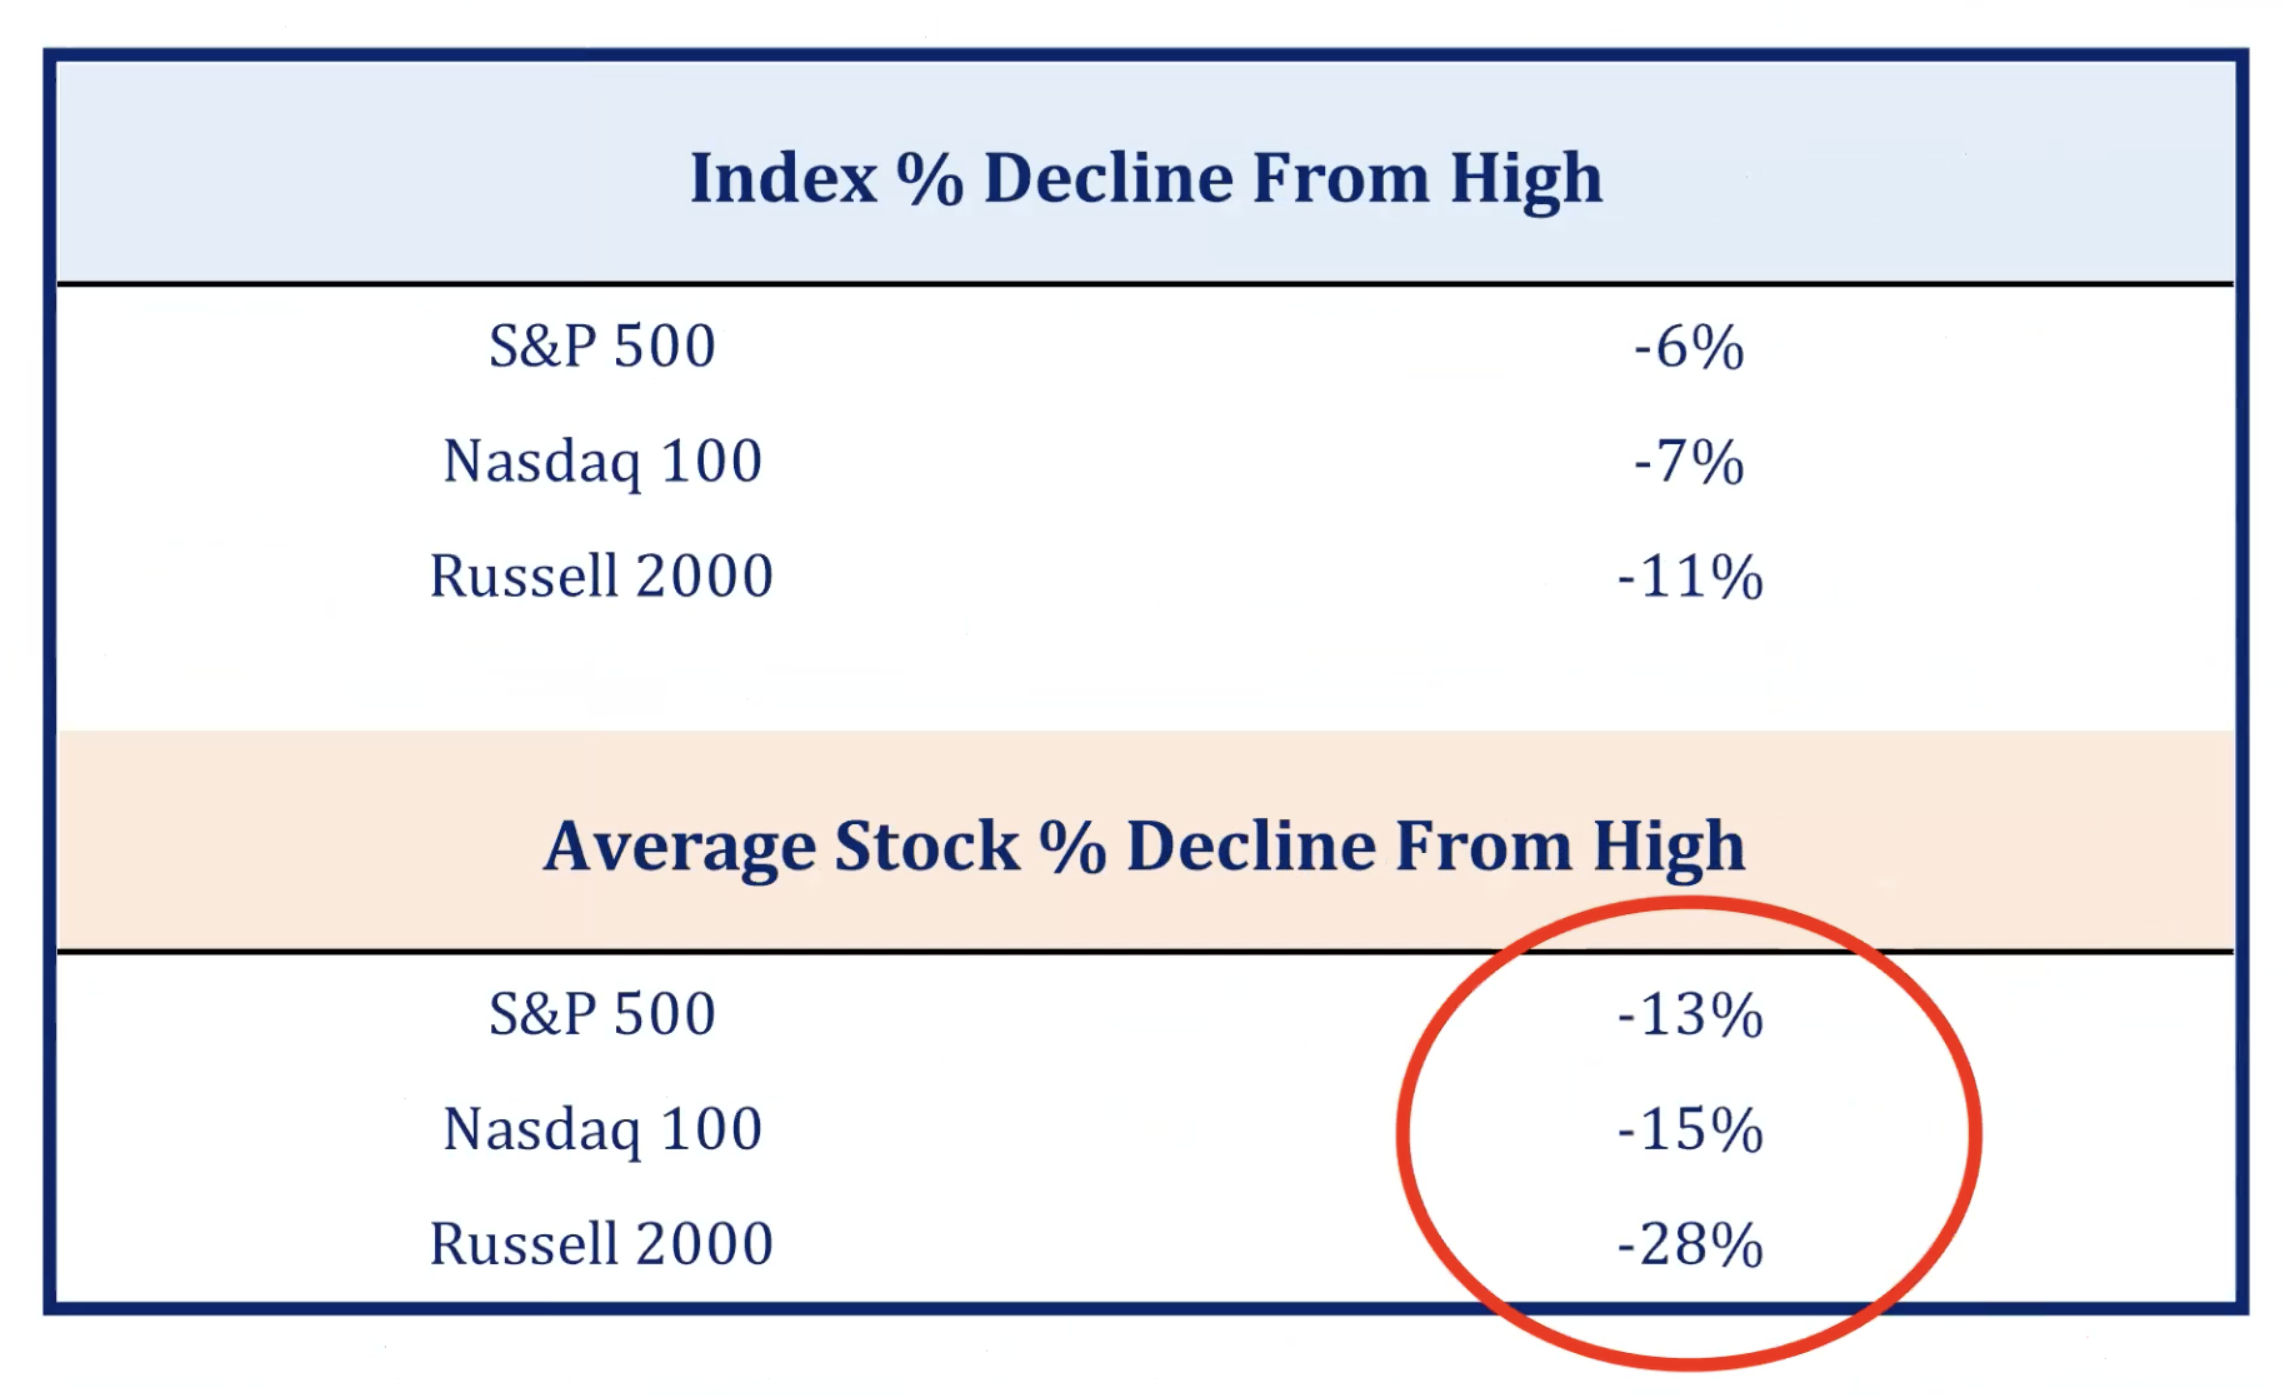
Headline risks are everywhere, and investors are justifiably focused on tail risks. We also find it noteworthy that most stocks within the major U.S. indexes (S&P 500, Russell 2000, and Nasdaq 100) have already corrected. See our Chart of the Month. If not for its three largest constituents, the S&P 500 index would have been negative for the quarter. Apple, Microsoft, and Google contributed 75 bps of the index’s return. The other 497 stocks detracted -17 bps.
Stocks have performed best during the fourth quarter over the past two decades with the S&P 500 averaging a 4.1% gain. The index hasn’t corrected this year and could at any time. However, some signs suggest the growth scare may be sufficiently priced in. Fundamentals are sound, and a supportive backdrop exists for equities: strong household balance sheets, a powerful corporate capital expenditures cycle, impactful productivity gains, and ample liquidity.
This week Q3 earnings season kicks off and may provide a basis for further upside as last year’s comps remain favorable. Like Warren Buffett, in our Quote of the Month, and our very own Director of Economics John Silvia often reminds us, what’s important for investors is to focus on the data and underlying economic forces, not narratives driven by political or ideological agendas.
Insights by John Silvia, Director of Economics

- September’s employment report highlights both the cyclical and structural aspects of the labor market and the economy. On the cyclical side, there were solid gains in manufacturing, construction, as well as trade & transportation. Leisure & hospitality did slow but still added jobs. A problem was the drop in local school employment that reflects both a seasonal adjustment and a signal that local schools have learned to do with fewer teachers.
- Structural issues are manifested in the drop in both the labor force and the employment-population ratio compared to February 2020. Therefore, it is not surprising that firms are complaining about the lack of skilled labor. The demand side of the labor market is strong; however, the supply side is lacking.
- Good news continues from the leading economic indicators, such as jobless claims and factory orders/shipments, which indicate continued positive economic growth above the two percent long-run trend for the rest of the year. Building permits have slowed and are consistent with the rising housing affordability problem.
- For 2021, economic growth is expected to be 6%, with solid gains in consumer spending, residential investment, and business investment. A slowdown to 4% growth is expected for 2022. Inflation rates have risen over the past year and are expected to present several challenges to investors as real returns on cash and sovereign debt continue to be negative.
- Benchmark Treasury yields have risen in the last month as statements from Federal Reserve policymakers have emphasized a move toward tapering soon. Meanwhile, Treasury debt issuance is expected to decline relative to a year ago, limiting any rise of interest rates as the Fed tapers. However, persistent inflation remains an issue for Treasury debt owners and buyers.
- As consistent with Fed policy intentions, we expect inflation and benchmark interest rates to rise, along with a steady decline in the U.S. dollar value. The longer-run view, consistent with Fed intentions, is for higher inflation and interest rates. Therefore, after inflation and taxes, real returns are often negative.
- Even within an economic expansion, there are periods of accelerating and decelerating growth/inflation benchmarks that can distract from the long-term goals of investors. Investment opportunities and risks change as the economic recovery evolves, often due to economic and policy changes. In addition, a new political administration has introduced new priorities concerning taxes, energy development, and infrastructure. All of these require further review of your portfolio.
Quote of the Month
“Games are won by players who focus on the playing field – not by those whose eyes are glued to the scoreboard.”
Warren Buffett
Chart of the Month
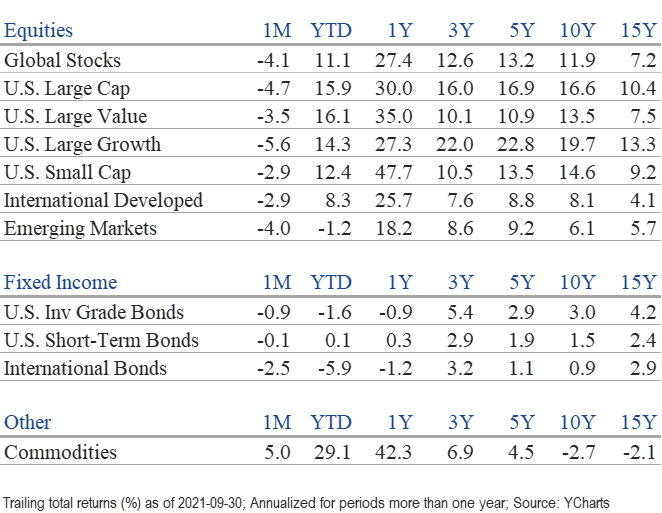
The information published herein is provided for informational purposes only, and does not constitute an offer, solicitation or recommendation to sell or an offer to buy securities, investment products or investment advisory services. All information, views, opinions and estimates are subject to change or correction without notice. Nothing contained herein constitutes financial, legal, tax, or other advice. The appropriateness of an investment or strategy will depend on an investor’s circumstances and objectives. These opinions may not fit to your financial status, risk and return preferences. Investment recommendations may change, and readers are urged to check with their investment advisors before making any investment decisions. Information provided is based on public information, by sources believed to be reliable but we cannot attest to its accuracy. Estimates of future performance are based on assumptions that may not be realized. Past performance is not necessarily indicative of future returns. The following indexes were used as proxies in the performance tables: Global Stocks = MSCI ACWI; U.S. Large Cap = S&P 500; U.S. Large Value = Russell 1000 Value; U.S. Large Growth = Russell 1000 Growth; U.S. Small Cap = Russell 2000; Int’l Dev Stocks = MSCI EAFE; Emerging Markets = MSCI EM; U.S. Inv Grade Bonds = Barclays U.S. Aggregate; U.S. High Yield Bonds = Barclays Corporate High Yield; Emerging Markets Debt = JPMorgan EMBI Global Diversified; Int’l Bonds = Barclays Global Treasury ex US; Cash = 3month T-Bill; Sector returns displayed in the chart represent S&P 500 sectors, while treasury benchmarks are from Barclays
Chart of the Month Source: Strategas, YTD as of 10/4/2021.
Chart of the Month
Quote of the Month
“Games are won by players who focus on the playing field – not by those whose eyes are glued to the scoreboard.”
Warren Buffett
Trailing Returns