Market Perspectives August 2021
Capital Markets
By: Wade Austin
Fueled by near-record level earnings and revenue beats, the S&P 500 continued to grind higher in July gaining 2.4% and posting its 6th consecutive month of positive total returns. We wrote last month about analysts’ lofty expectations heading into the Q2 corporate earnings season. With 443 of the S&P 500 companies reported, earnings grew 93% YOY-far surpassing the 64% profit growth forecasted in early July. Revenues also surged 23.5%. The stellar U.S. large-cap corporate results were broad-based as both earnings and revenue growth exceeded analysts’ expectations for each of the eleven equity sectors.
Given such superior financial performance, price action was quite muted due to a variety of forward-looking headwinds. The chief concerns remain the surging spread of the Covid-19 Delta variant, supply chain bottlenecks, signs of U.S. and global growth peaking, elevated inflation measures, and impending corporate and capital gains tax increases.
Globally, China’s aggressive regulatory crackdown on its own technology companies, initiated in July, shocked investors causing an abrupt selloff of Chinese equities. While Emerging Market indexes ex-China have performed well, Chinese stocks still comprise approximately 33% of the broad EM ETFs. As a result, the MSCI EM index was down -6.7% in July erasing all its gains YTD.
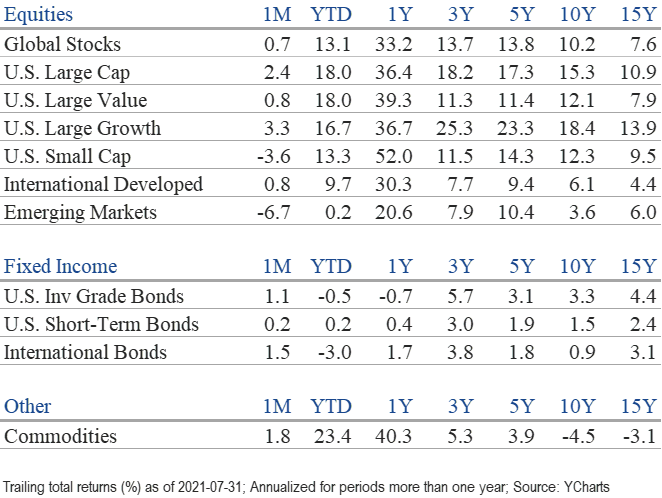
The growth scare was first reflected in fixed income markets in the Spring and quietly began impacting stocks underneath the surface of major indexes. The reflation trade that had propelled value and small-cap stocks to leadership paused as growth and large-cap stocks reasserted themselves. In July alone, large-caps exceeded small by 6.0 points, while growth outpaced value by 2.5 points.
Beginning in April, government bond yields continued their decline, primarily due to the growth scare sparked by the highly transmissible Covid-19 Delta variant and ongoing support from major central banks. After doubling during Q1 to 1.74%, the yield on U.S. 10-Yr. Treasury notes dropped as low as 1.12% by late July. For the month, it declined another 25 bps to 1.22%, while the 10-Yr. German Bund yield closed July at -0.46% after recently flirting with zero. As a result, total returns across all primary fixed income sectors posted positive total returns for the month. Tax-free municipal bonds (+1.90%) have substantially outperformed the U.S. Aggregate Bond index (-0.50%) YTD.
Despite this current four-month trend, we suspect 1.12% was in the vicinity of a near-term bottom and expect increases in yields in the months ahead. If our Director of Economics, John Silvia, is correct in his view that inflation will prove stickier than the Fed is suggesting, eventual Fed tapering and additional fiscal stimulus (proposed new $500B infrastructure and $3.5T tax and spending packages) should place upward pressure on inflation and yields.
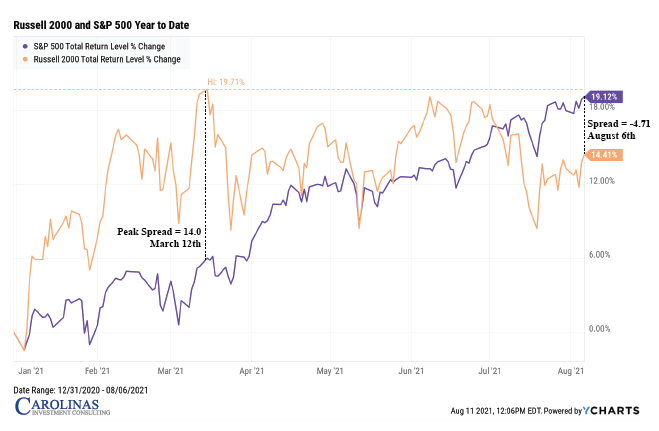
The course for inflation is also central to the current tug-of-war between growth and value stocks as well as large and small-cap stocks. Our Chart of the Month, originally sourced from The Leuthold Group, plots the YTD performance of the Russell 2000 against the S&P 500. Small-caps built a 14.0% lead by March 12th but now trail large-caps 4.7% as of August 6th.
Small-caps have usually recovered from prior dramatic intra-year reversals to outperform for the full year which often signaled a multi-year leadership phase. If the Delta variant surge does peak in the next month as predicted by some U.S. health officials, we won’t be surprised if the reflation trade reawakens.
Insights by John Silvia, Director of Economics

Above trend economic growth, persistent inflation pressures and a reactive Fed remain the benchmarks of the outlook – as they have since the beginning of this year.
- Leading economic indicators support the case for 3%+ economic growth for the rest of this year. Jobless claims continue to decline. Factory orders, shipments, and now unfilled orders indicate further gains in employment and industrial production. Job gains and consumer sentiment supports consumer spending. Building permits have slowed as housing affordability has become an issue.
- For all of 2021, we maintain our expectation that economic growth will be 6%+ with strong gains in consumer spending, residential investment, and business investment. Inflation rates have risen over the past year. The rise in inflation certainly has not been transitory and is a challenge to cash and short-term Treasury debt valuations.
- For July, we witnessed a very strong employment report with broad-based job gains. In that report, average wage gains came in at 4% YOY. Meanwhile, the consumer price inflation data for June came in at 5.4%, and even excluding food and energy, the rate of inflation came in at 4.5%.
- Current monetary policy is expected to remain on hold, and the Fed is unlikely to raise the funds rate over the next six to nine months. Meanwhile, fiscal policy is expected to continue with a rapid pace of federal spending.
- As consistent with Fed policy intentions, our expectation is that rising inflation, but steady benchmark interest rates, promotes caution in the outlook for financial assets. Recently, bond yields have declined, but this runs counter to the longer-run view, consistent with Fed intentions, for higher inflation and interest rates.
- Meanwhile, equity values continue to run with the economy. Even within an economic expansion, there are periods of accelerating and decelerating growth and inflation benchmarks that can distract from the long-run goals of investors. Investment opportunities and risks change as the economic recovery evolves often due to changes in inflation, interest rates, and the value of the dollar.
Clients have been rewarded by following the fundamentals and taking a longer view of their position. Recessions are part of the economic cycle, but recovery and expansion are longer lasting. This has not changed.
Quote of the Month
“The big profits go to the intelligent, careful and patient investor, not to the reckless and over eager speculator.”
J. Paul Getty
Chart of the Month
The information published herein is provided for informational purposes only, and does not constitute an offer, solicitation or recommendation to sell or an offer to buy securities, investment products or investment advisory services. All information, views, opinions and estimates are subject to change or correction without notice. Nothing contained herein constitutes financial, legal, tax, or other advice. The appropriateness of an investment or strategy will depend on an investor’s circumstances and objectives. These opinions may not fit to your financial status, risk and return preferences. Investment recommendations may change, and readers are urged to check with their investment advisors before making any investment decisions. Information provided is based on public information, by sources believed to be reliable but we cannot attest to its accuracy. Estimates of future performance are based on assumptions that may not be realized. Past performance is not necessarily indicative of future returns. The following indexes were used as proxies in the performance tables: Global Stocks = MSCI ACWI; U.S. Large Cap = S&P 500; U.S. Large Value = Russell 1000 Value; U.S. Large Growth = Russell 1000 Growth; U.S. Small Cap = Russell 2000; Int’l Dev Stocks = MSCI EAFE; Emerging Markets = MSCI EM; U.S. Inv Grade Bonds = Barclays U.S. Aggregate; U.S. High Yield Bonds = Barclays Corporate High Yield; Emerging Markets Debt = JPMorgan EMBI Global Diversified; Int’l Bonds = Barclays Global Treasury ex US; Cash = 3month T-Bill; Sector returns displayed in the chart represent S&P 500 sectors, while treasury benchmarks are from Barclays
Chart of the Month
Quote of the Month
“The big profits go to the intelligent, careful and patient investor, not to the reckless and over eager speculator.”
J. Paul Getty
Trailing Returns