Market Perspectives December 2023
Capital Markets
By: Wade Austin
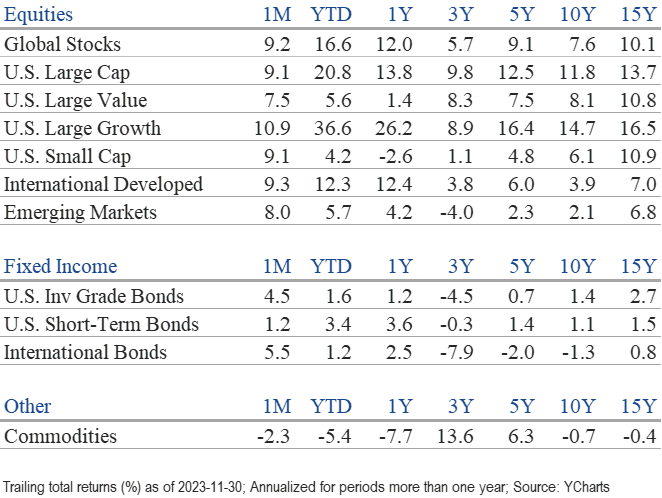
For investors, November was a month to remember as U.S. stocks posted one of their best months since 2003 in snapping a three-month losing streak. The S&P 500’s 9.1% total return ranked as the 18th best month since the index’ official inception in 1957. The bond rally was even more impressive on a relative basis. The Bloomberg U.S. Aggregate Bond Index’s 4.5% return was its best monthly gain since 1985. The primary market catalyst was a series of economic releases, indicating inflation continued to ease in October more than expected. The pleasant surprise triggered a sharp decline in Treasury yields and boosted expectations that there would be no more Federal Reserve rate hikes this cycle.
In an encouraging sign for the overall U.S. stock market, breadth widened in the second half of the month as leadership shifted from the “Magnificent Seven” to the other 2,993 companies comprising the broad Russell 3000 Index. The last week of November broke a 16-week streak in which the number of S&P 500 constituents making new 50-day price lows had exceeded those making new 50-day highs. While the “Magnificent Seven” contributed an exceptionally high portion (80%) of the S&P 500’s YTD gain of 20.8%, its contribution declined from 94% of the index’s YTD performance the prior month.
Many of November’s top gainers were laggards for most of this year, but a number of the companies in the sectors most sensitive to high borrowing costs rallied more than 10%. Battered sectors like real estate and financials surged to double-digit gains, although technology (+12.9%) was the monthly leader. By month’s end, the Dow Jones Industrial Average posted a six-week winning streak and closed at its highest level since January 2022. Even small-cap stocks, which had suffered a harsh three-month decline, matched large-cap monthly returns. Global stocks joined the rally, with international stocks’ 9.3% gain edging U.S. large-caps as the month’s top performer. Emerging market stocks gained 8.0%, led by double-digit monthly returns in South Korea, Mexico, and Brazil.
The rally in bonds began in late October after the 10-year U.S. Treasury yield reached 5%. The benchmark yield dropped 60 bps in November and fell to 4.12% by Dec. 6, as investors anticipate the timing of the first rate cut in 2024. All major fixed income sectors enjoyed a stellar November. Municipals, investment grade bonds, and mortgage-backed securities outperformed Treasuries and the broad index. Muni’s spectacular 6.4% return was its best November in 40 years. Investment grade corporate bonds returned 6.0% after six straight weeks of gains.
The U.S. dollar sank with lower rates, while crude oil retreated toward $70/barrel from its September high of $93 as global economic growth moderated. However, precious metals surged, with gold rising above $2,000 for the first time since May. Reaching $2,038 by month’s end, gold gained 12% since early October.
Historically, November has been the best-performing month for the S&P 500, and it only enhanced its reputation this year. But December is also one of the best months for stocks on average, with most of its gains often generated during a Santa Claus rally in the latter half. The data also suggests that an exceptionally robust November has little bearing on December’s performance.
Legendary investor Charlie Munger, who passed away last week just days from his 100th birthday, offered excellent advice to investors throughout his career. As we approach a new year, we also enter market forecast season. With a tip of the hat to a phenomenal career and investment track record, one of Mr. Munger’s famous quotes reminds us there is wisdom in not taking predictions too seriously: “I think I’m pretty good at long-run expectations, but I don’t think I’m good at short-term wobbles. I don’t have the faintest idea what’s going to happen short term.”
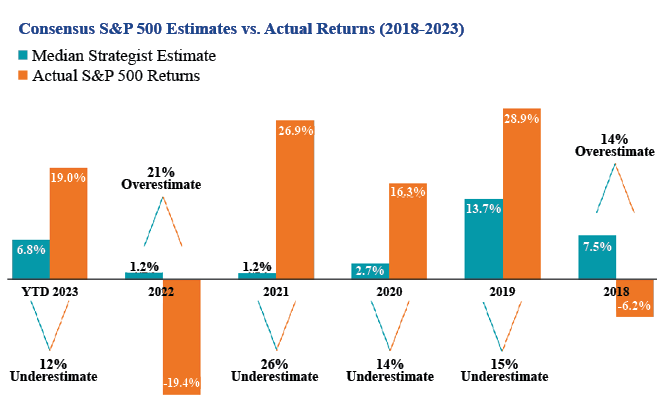
No one has consistently made accurate short-term or even annual prognostications. Take this year, for example. Wrapping up an awful 2022, Wall Street strategists’ 2023 performance estimates for the S&P 500 varied widely, according to research compiled by Avantis Investors. The index ended 2022 at 3840. Predictions for the year ranged from a low of 3400 to a high of 4750, with a median of 4100. Fast-forward to the end of November. The S&P 500 had risen to 4568, above the second-highest estimate (one which was likely dismissed by most as Pollyannish) and 12% above the mean.
Further, the dismal 2023 forecasting record was not an anomaly. Our Chart of the Month compares consensus estimates with actual returns for the past six years. The strategists’ most accurate year was, believe it or not, 2023! On average, the median estimate was off by 18 percentage points. Adjusting portfolio allocations based on market calls with no predictive power can often be detrimental. Recognizing that volatility, surprises, and unpredictability are realities of markets allows investors to focus on the big picture and to avoid the temptation and pitfalls of trying to time markets.
Insights by John Silvia, Director of Economics
Over the last three months, we have emphasized “all things in moderation.” That approach has turned out to be beneficial for the economic outlook and investors. The S&P 500 Index is up, and long-term interest rates tumbled over the last month.
- Economic indicators signal moderating economic growth and inflation. In addition, expectations for Fed policy/short-term interest have tempered the view of a rise in the funds rate over the next six months. Treasury finance in a slower growth economy does create a problem of rising real interest rates, which we have witnessed over the last six months.
- Moderation in expectations for economic growth has manifested in the slower pace of job gains, slower growth in capital goods orders, and a modest rise in jobless claims.
- For the three months ending in October, job gains averaged lower than the pace over the past year. Meanwhile, the unemployment rate has risen to 3.9%, above the rate over the last three- and twelve-month benchmarks. Finally, growth in average hourly earnings has moderated over the previous three months, below the pace of a year ago. This indicator is a key signpost for inflation for the Fed and supports the view that the Fed is on hold for policy.
- Second, inflation remains sticky, but there are also signals of moderation. The core PCE deflator that serves as the benchmark for inflation for the Fed has slowed to a pace of 2.4% growth over the last three months, compared to a gain of 3.5% over the last year.
- Third, the FOMC continues to signal their data dependence. In his latest press conference, Chairman Powell of the Federal Reserve cited that “inflation has moderated,” and the FOMC left rates unchanged. We expect the FOMC to leave rates unchanged at their December meeting.
- Finally, the imbalance between projected federal debt finance and potential economic growth remains. This imbalance has pushed up real rates over the last six months despite declining nominal rates and inflation.
- One notable shift in economic fundamentals is the recent gains in productivity, which support the case for reduced cost pressures and increased profit gains. In the third quarter, productivity was up 4.7% and has improved to 2.2% over the last year. These results are positive for investors, as unit labor costs have declined.
- To pick up on our earlier commentaries, the forecast for sustained, higher long-run Treasury market interest rates compared to the decade of 2012-2019 has indeed happened. A continued rise in the federal debt-to-GDP ratio over the years ahead (as projected by the Congressional Budget Office) and the threat of another credit downgrade will be associated with higher real interest rates in the long term. While nominal interest rates have declined, real interest rates remain above the levels of the last decade.
- Lower interest rate expectations, reflecting a neutral Fed policy, have delivered U.S. dollar declines.
- The Dallas Fed Trimmed Mean PCE inflation rate is 3.64%. This is a moderation in the pace of inflation, but the level signals little likelihood that the Fed would ease soon, given the pace of inflation remains far above target.
- Corporate profits improved in the third quarter. Domestic nonfinancial profits are now up two quarters in a row and also up from over a year ago. Better productivity numbers and lower interest rates have helped, and equity prices reflect the gains in profits.
Quote of the Month
“I think I’m pretty good at long-run expectations, but I don’t think I’m good at short-term wobbles. I don’t have the faintest idea what’s going to happen short term.”
Charlie Munger, American Investor, Businessman, and Philanthropist
The information published herein is provided for informational purposes only, and does not constitute an offer, solicitation or recommendation to sell or an offer to buy securities, investment products or investment advisory services. All information, views, opinions and estimates are subject to change or correction without notice. Nothing contained herein constitutes financial, legal, tax, or other advice. The appropriateness of an investment or strategy will depend on an investor’s circumstances and objectives. These opinions may not fit to your financial status, risk and return preferences. Investment recommendations may change, and readers are urged to check with their investment advisors before making any investment decisions. Information provided is based on public information, by sources believed to be reliable but we cannot attest to its accuracy. Estimates of future performance are based on assumptions that may not be realized. Past performance is not necessarily indicative of future returns. The following indexes were used as proxies in the performance tables: Global Stocks = MSCI ACWI; U.S. Large Cap = S&P 500; U.S. Large Value = Russell 1000 Value; U.S. Large Growth = Russell 1000 Growth; U.S. Small Cap = Russell 2000; Int’l Dev Stocks = MSCI EAFE; Emerging Markets = MSCI EM; U.S. Inv Grade Bonds = Barclays U.S. Aggregate; U.S. High Yield Bonds = Barclays Corporate High Yield; Emerging Markets Debt = JPMorgan EMBI Global Diversified; Int’l Bonds = Barclays Global Treasury ex US; Cash = 3month T-Bill; Sector returns displayed in the chart represent S&P 500 sectors, while treasury benchmarks are from Barclays
Source: Schwab Center for Financial Research with data provided by Morningstar, Inc., as of 3/31/2022. Asset class performance represented by annual total returns for the following indexes: S&P 500® Index (US Lg Cap), Russell 2000® Index (US Sm Cap), MSCI EAFE® Net of Taxes (Int’l Dev), MSCI Emerging Markets IndexSM (EM), MSCI US REIT Index (REITs), S&P GSCI® (Comm.), Bloomberg Barclays U.S. Treasury Inflation-Linked Bond Index (TIPS), Bloomberg Barclays U.S. Aggregate Bond Index (Core US Bonds), Bloomberg Barclays U.S. High Yield Bond Index (High Yield Bonds), Bloomberg Barclays Global Aggregate Ex-USD TR Index (Int’l Dev Bonds), Bloomberg Barclays Emerging Markets USD Bond TR Index (EM Bonds), FTSE U.S. 3-Month T-Bill Index (T-Bills). Past results are not an indication or guarantee of future performance. Returns assume reinvestment of dividends, interest, and capital gains. Indexes are unmanaged, do not incur fees or expenses, and cannot be invested in directly.
Chart of the Month: Avantis Investors


