Market Perspectives – October 2017
Capital Markets
The third quarter produced positive market results for the 8th consecutive quarter, a feat that hadn’t happened in the last 20 years. U.S. large cap stocks are up more than 14% on the year while international stocks are up 20% for 2017. Small cap beat large cap stocks on the quarter due to a September rally in small caps. In addition to the recent rally in small caps, large cap value stocks beat growth stocks in September after lagging their growth counterparts during 2017. Despite a pause in September, emerging markets stocks led the equity markets again in Q3.
Bonds have posted reasonable strong results this year when considering their starting yields. As with stocks, international bonds have performed better than the U.S. As we discussed in the last issue of Market Perspectives, the Fed announced their plan to unwind crisis era stimulus off of their balance sheet. Further, they signaled future rate hikes for the short term Fed Funds rates. We continue to expect a rate increase in December from the Fed. Bonds posted slightly negative returns in September in response to the Fed’s announcement.
Commodities have been the worst performing asset class in 2017 but did post a solid gain in Q3. For the year, they remain the only major asset class with negative returns. Investing in commodities over the last 15 years has led to returns near zero. The asset class was once the darling of Wall Street but has now been cast aside as a losing bet. We don’t know which way commodities will go from here, but we caution investors not to cast aside an asset class simply because of such terrible results. We think commodities have underperformed for two reasons, (1) they tend to do well when interest rates go up, rather than down, and (2) too much money chased their strong performance over the last 20 years. Typically when a lot of money flows into an asset class it bids up the price and results in worse future returns. Today, we see large outflows in commodity related investments and we believe the prospect for gradual interest rate normalization could be beginning. Both headwinds could present tailwinds into the future and we think investors should at least pay attention.
We continue to believe that we have entered the final stage of the bull market. As the fourth quarter begins, signs of excess, euphoria, and greed are gradually appearing. Final stages of bull markets can be very profitable and can last longer than most expect. Its important to participate in gains but not to become overexposed to too much risk at this stage.
When 3 x 2 Doesn’t Equal 6
Recently, I came across two ETFs that focused on Russian investments. Both ETFs offer “3X” exposure to the Russian stock market. One is a “Bear” (shorting the stock market) and one is a “Bull” (Buying the stock market) ETF. A few thoughts:
- ETFs that offer leveraged exposure to the stock markets seem to be vastly misunderstood. These types of investment vehicles are not intended for investor use but rather for day traders.
- A 3X ETF is designed to provide 3 times the return of the stock market for one day. Each day, the ETF rebalances its leverage to deliver 3 times the return for the next day.
- A quick example: If the stock market goes up by 5% one day, a 3X ETF (assuming no costs) will be up $15 for a $100 investment. But if the next day, the stock market declines by 5%, the investment (now $115) will lose $17.25 meaning after two days the investor has lost $2.25
- Another misunderstood issue with these vehicles is that daily trading adds a lot of cost because of the daily leverage rebalance.
- The most extreme examples of performance differences between the 3X ETFs and the stock market are in the emerging markets. The charts to the left show annualized performance since the Russian and Chinese ETFs were launched.
- In Russia, the stock market has lost 5.42% annualized since June 2011 but the 3X Bull ETF has lost 44% and most shockingly the Bear ETF (which theoretically should have had positive results) is down 40% annualized. To put this in context, the investor in the 3X Bear ETF would have lost 95% of their money so far and they have been short a stock market that has gone down!
- In the case of the Chinese equity ETFs, the stock market has been positive by 5.84% since 2010 but the 3X Bull ETF is negative and the 3X Bear ETF has lost more than 90% of its value in this time. While these are extreme examples of the leveraged ETF return disparities, these same issues exist with all leveraged ETFs.
In short, the cost of leverage and transaction costs erode the long-term returns of 3X vehicles. They are intended for professional day traders only.
The information published herein is provided for informational purposes only, and does not constitute an offer, solicitation or recommendation to sell or an offer to buy securities, investment products or investment advisory services. All information, views, opinions and estimates are subject to change or correction without notice. Nothing contained herein constitutes financial, legal, tax, or other advice. The appropriateness of an investment or strategy will depend on an investor’s circumstances and objectives. These opinions may not fit to your financial status, risk and return preferences. Investment recommendations may change and readers are urged to check with their investment advisors before making any investment decisions. Information provided is based on public information, by sources believed to be reliable but we cannot attest to its accuracy. Estimates of future performance are based on assumptions that may not be realized. Past performance is not necessarily indicative of future returns. The following indexes were used as proxies in the performance tables: Global Stocks = MSCI ACWI; U.S. Large Cap = S&P 500; U.S. Large Value = Russell 1000 Value; U.S. Large Growth = Russell 1000 Growth; U.S. Small Cap = Russell 2000; Int’l Dev Stocks = MSCI EAFE; Emerging Markets = MSCI EM; U.S. Inv Grade Bonds = Barclays U.S. Aggregate; U.S. High Yield Bonds = Barclays Corporate High Yield; Emerging Markets Debt = JPMorgan EMBI Global Diversified; Int’l Bonds = Barclays Global Treasury ex US; Cash = 3month T-Bill; Sector returns displayed in the chart represent S&P 500 sectors, while treasury benchmarks are from Barclays
Quote of the Month
“Trying to reason with Hurricane Season”
Jimmy Buffett
Chart of the Month
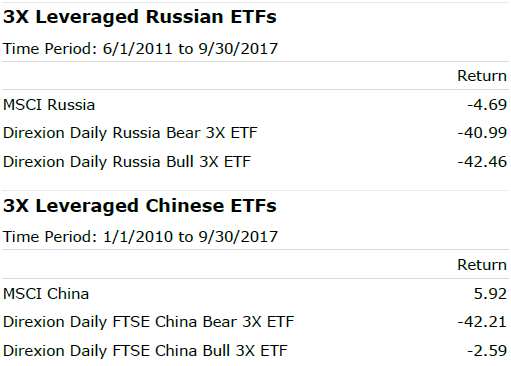
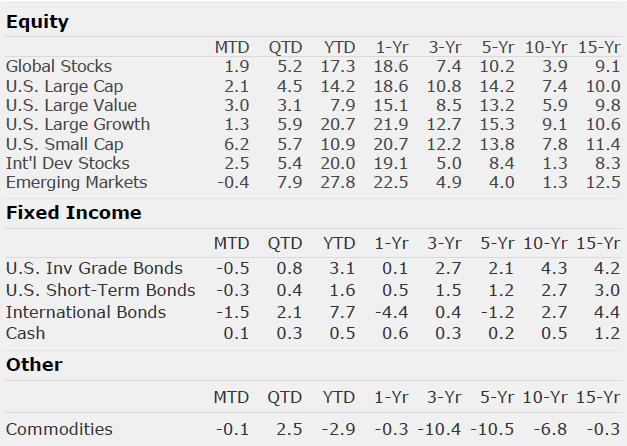
Chart of the Month
Quote of the Month
“Trying to reason with Hurricane Season”
Jimmy Buffett
Trailing Returns