Market Perspectives – November 2017
Capital Markets
In October 2017, the S&P 500 delivered its 12th consecutive positive monthly gain, a feat that has never been recorded in the history of the index. Market momentum is near all-time highs as the prices of the S&P 500, Dow Jones Industrial Average, and NASDAQ continue to soar. As with much of the year, large cap beat small cap stocks and emerging markets led all major asset classes. International developed stocks lagged U.S. stocks slightly in October, but remain ahead year-to-date. The U.S. Dollar appreciated against many developed markets currencies in October which boosted U.S. stocks in the month.
Bonds were flat for the month as interest rates ticked up slightly. The Fed seems to have their “sea legs” under them as they continue to exercise their plan for the balance sheet unwinding and future monetary tightening. We continue to expect a third rate hike in December 2017, and markets seem to be coming around to the idea of a December hike after the Fed’s November comments.
News broke on November 2nd that President Donald Trump had tapped Jerome Powell to be the next Chair of the Federal Reserve. Markets greeted both the rumors and news with delight in recent days. Mr. Powell is viewed to be the least “hawkish” option for Mr. Trump (excluding current Chairwoman Janet Yellen who has tended to be the most dovish of the group). A Powell appointment seems to signal a continuation of the current Fed exit strategy and limits near-term risks that the Fed will exert extreme tightening in the current economic environment. Markets seemed to favor Mr. Powell or Ms. Yellen over the other candidates and cheered the nomination.
Set to grow at double digit growth rates in 2017, earnings have provided a nice boost for the markets. Further, most economic data was encouraging for the month, as the economy continues to add jobs, GDP growth stays above trend, and inflation remains muted. Although the lack of wage growth suggests some slack exists, the labor market is growing very tight.
The House GOP released its first full draft of tax reform in early November and markets will continue focus on Washington. We suspect tax reform will take longer than many expect, but any policies that increase corporate earnings should benefit stock prices.
The Slowly Shrinking Stock Market
Twenty years ago, the number of publicly traded stocks was increasing at a very rapid pace. Today, there are approximately 4,300 companies traded publicly in the U.S. In 1996, there were more than 8,000 listed stocks. Source: WorldBank
- A number of accounting scandals (i.e. Enron, Worldcom) in the late 1990s and early 2000s led to enhanced regulation for publicly traded stocks. Initial Public Offerings (“IPO”) dropped significantly, from more than 800 in 1996 to 143 in 2015. Source: WilmerHale Dealbook
- Private equity firms stepped in to fill the void. According to pitchbook.com, the number of active private equity firms rose by 143% from 2000-2014.
- Due to strong historical returns, institutional investors such as pension funds, endowments, and sovereign wealth funds have increasingly invested in private equity as a means to access a broader group of companies with the hope of receiving outsized returns.
- Demand for private equity investing has led to more transactions between private buyers. Consequently, an entrepreneur hoping to raise capital from venture capital firms may see many rounds of capital raises before considering an IPO.
- While there are fewer IPOs each year, the market value of companies going public has increased. In 1996, the median IPO offering size was $30M and in 2015 it was $92M. Source: WilmerHale Dealbook
- As companies have remained private longer, the increased value of their growth has benefited a select few, primarily company founders, private equity professionals, and institutional investors. Main Street investors who lack access to private equity have seen limited benefit from this growth.
- In recent years, private equity firms have begun targeting individual investors & family offices, which must ensure they have the ability to invest in illiquid investments, partner with top managers, and not pay excessive fees.
- Lastly, we suspect the lower number of publicly traded stocks has made it harder for active stock pickers to beat the market. We will explore active and passive investing in later editions.
The information published herein is provided for informational purposes only, and does not constitute an offer, solicitation or recommendation to sell or an offer to buy securities, investment products or investment advisory services. All information, views, opinions and estimates are subject to change or correction without notice. Nothing contained herein constitutes financial, legal, tax, or other advice. The appropriateness of an investment or strategy will depend on an investor’s circumstances and objectives. These opinions may not fit to your financial status, risk and return preferences. Investment recommendations may change and readers are urged to check with their investment advisors before making any investment decisions. Information provided is based on public information, by sources believed to be reliable but we cannot attest to its accuracy. Estimates of future performance are based on assumptions that may not be realized. Past performance is not necessarily indicative of future returns. The following indexes were used as proxies in the performance tables: Global Stocks = MSCI ACWI; U.S. Large Cap = S&P 500; U.S. Large Value = Russell 1000 Value; U.S. Large Growth = Russell 1000 Growth; U.S. Small Cap = Russell 2000; Int’l Dev Stocks = MSCI EAFE; Emerging Markets = MSCI EM; U.S. Inv Grade Bonds = Barclays U.S. Aggregate; U.S. High Yield Bonds = Barclays Corporate High Yield; Emerging Markets Debt = JPMorgan EMBI Global Diversified; Int’l Bonds = Barclays Global Treasury ex US; Cash = 3month T-Bill; Sector returns displayed in the chart represent S&P 500 sectors, while treasury benchmarks are from Barclays
Quote of the Month
“The outlook for the economy is, as always, highly uncertain.”
Janet Yellen
Chart of the Month
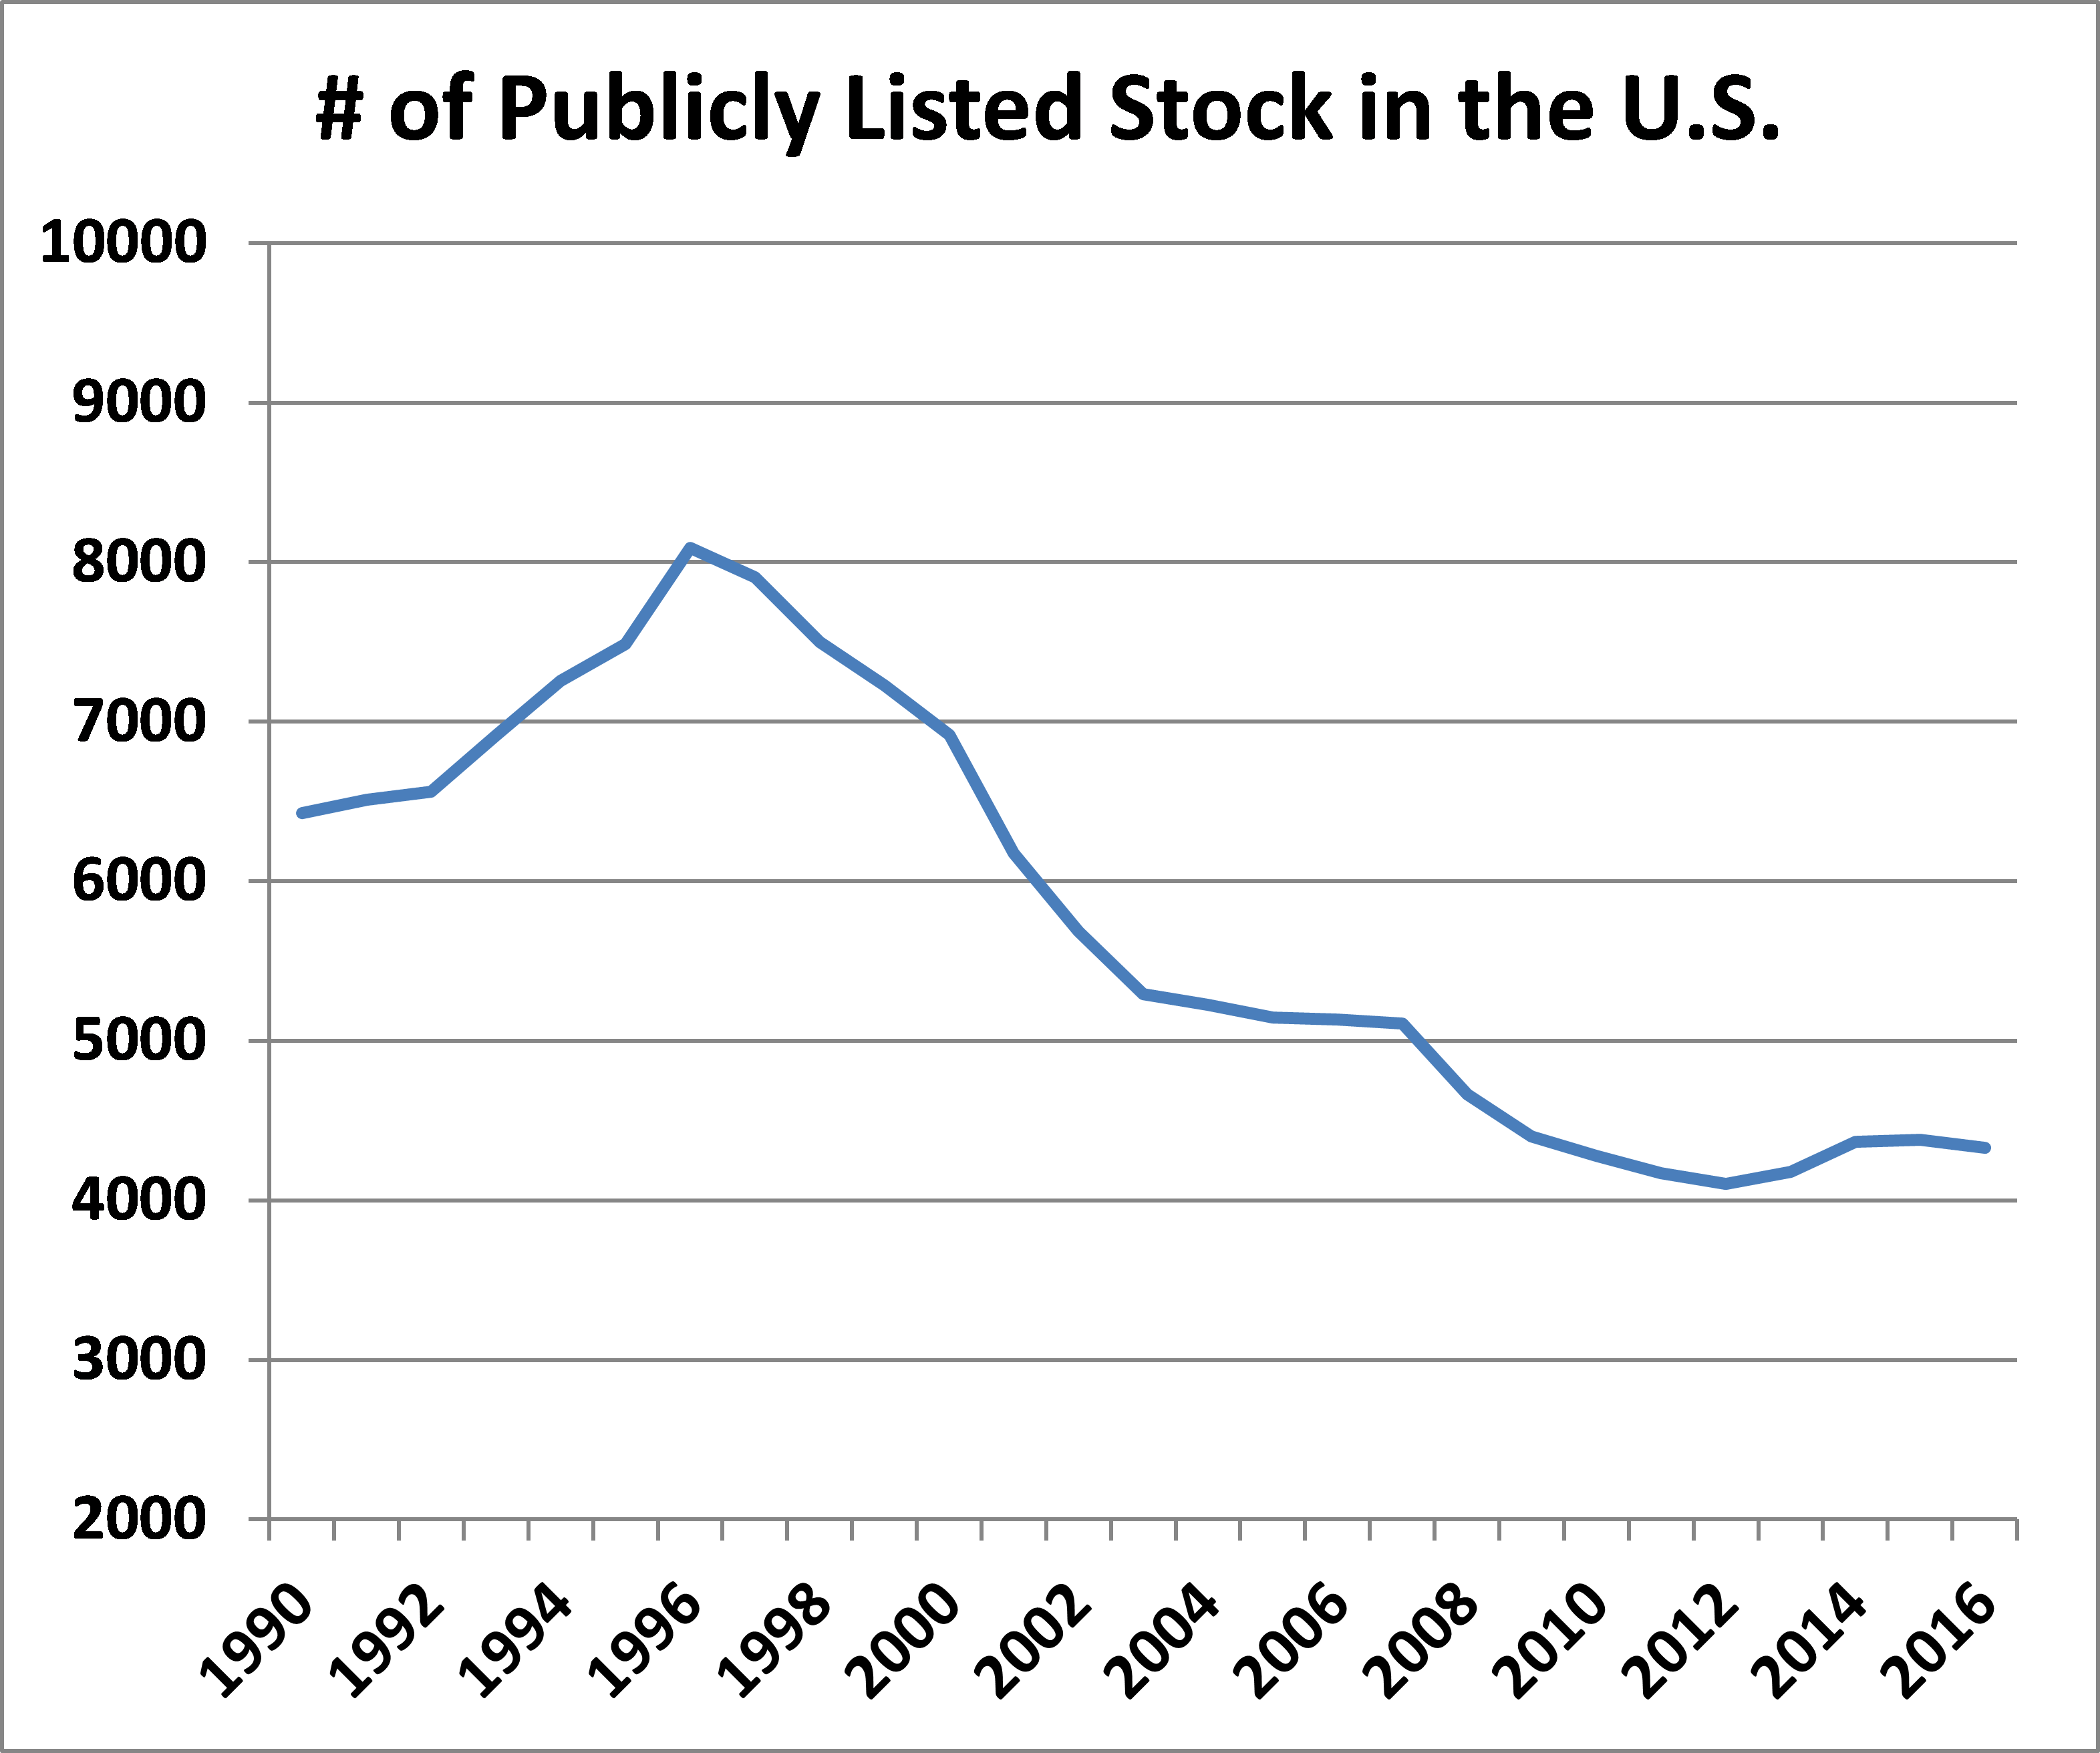
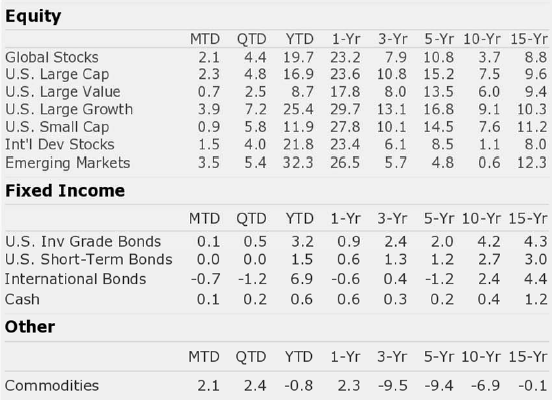
Chart of the Month
Quote of the Month
“The outlook for the economy is, as always, highly uncertain.”
Janet Yellen
Trailing Returns