Market Perspectives – May 2020
Capital Markets
By: Wade Austin
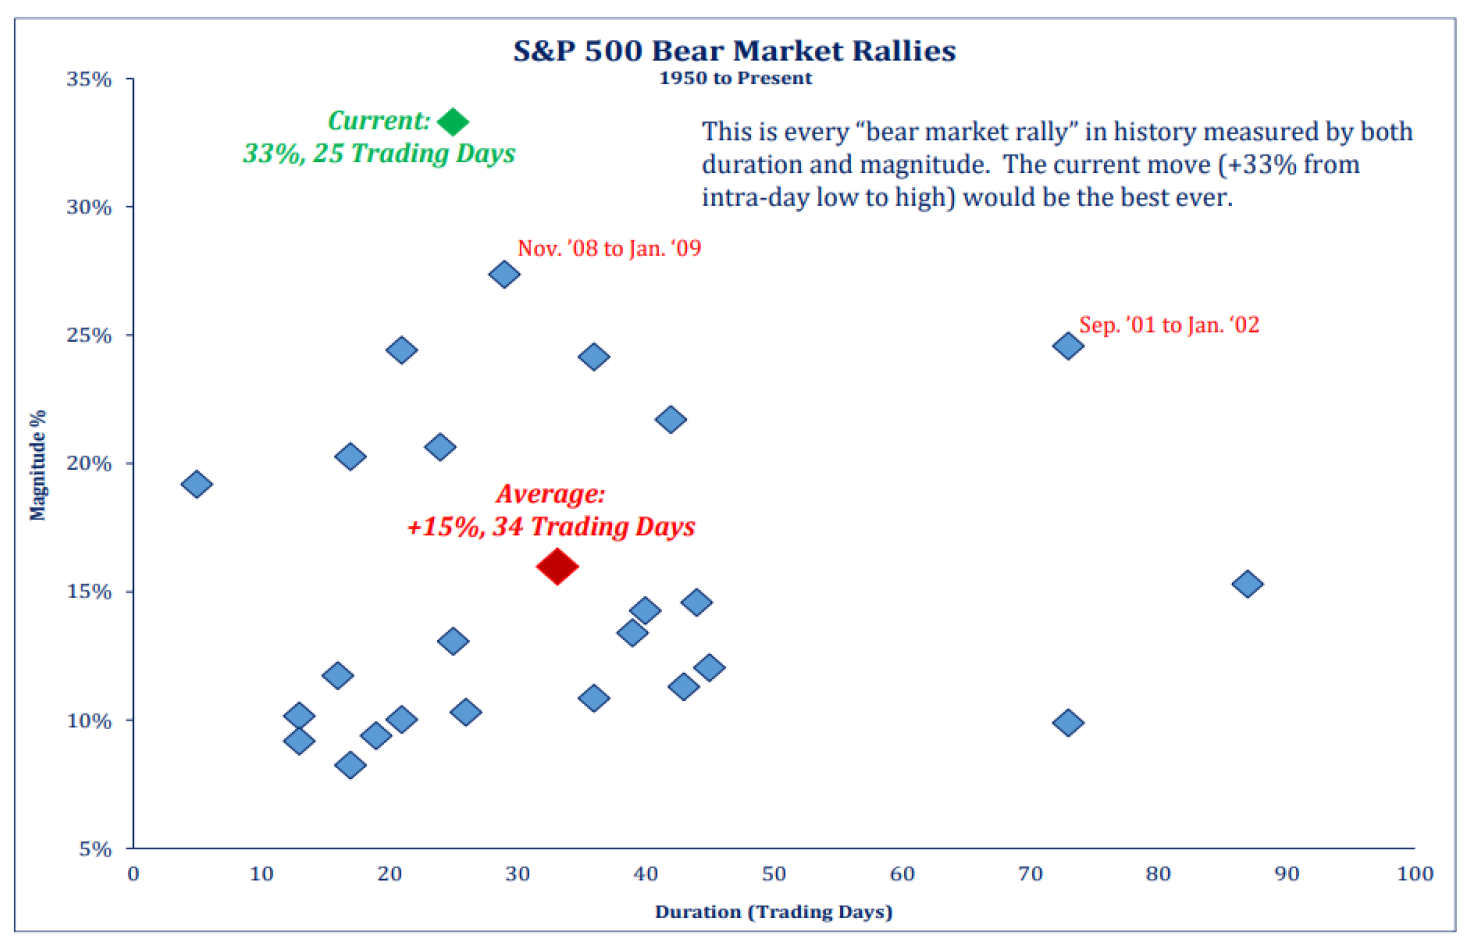
From February 19th to March 23rd, the S&P 500 fell 34% as the “Great Lockdown” wreaked economic havoc and sparked alarming Depression fears. After massive monetary and fiscal policy responses to backstop the economy, encouraging testing results and therapeutic trials led to hopeful, measured plans to re-open, financial conditions stabilized. The S&P 500 swiftly rose 35% from that low as of April 29th.
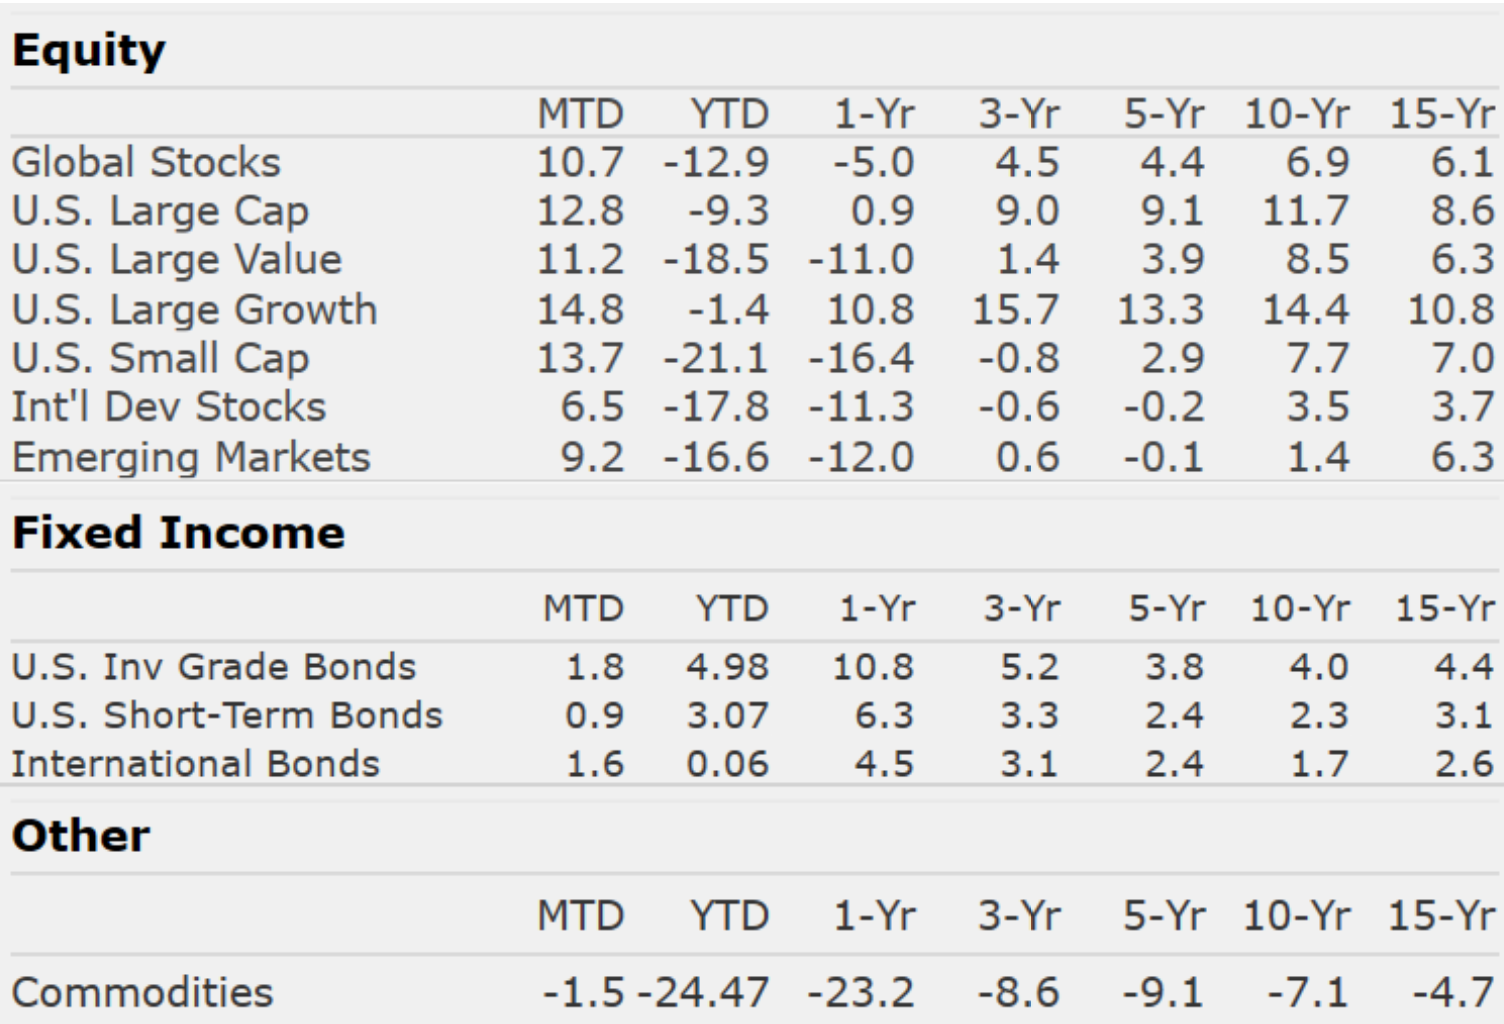
The S&P 500’s April 12.8% monthly return was the best since January 1987, but it’s still down 9.3% YTD. Fixed income markets, suffering from March’s liquidity shock, also found firmer footing. Investment grade corporates posted five consecutive weekly gains, and all fixed income sectors outpaced similar-duration Treasuries.
However, as the Fed noted during its April meeting, we are clearly not out of the woods yet. The virus remains devastatingly tragic in health and economic terms. Consequently, volatility persists at exceptionally high levels – a record 48 consecutive days (and counting) of > 1% intraday price swings through April 30th.
Looking ahead, the bull case rests on central bank easing, more fiscal stimulus, momentum, and contrarian sentiment. The bear case pivots on the magnitude of economic damage, elevated valuations, and the vulnerability of re-openings to the virus’ second wave.
Covid-19 has accelerated pre-existing trends, exposed weaknesses in the global economy, and created new trends. Caution is clearly warranted, yet human, societal, and economic dynamics offer rewards for active managers to discern the divergence of winners and losers.
Insights by John Silvia, Director of Economics

Signs of Light at the End of the Tunnel
With the recession upon us, we must distinguish between the gloom today and the future economic recovery. Current numbers on employment and retail sales speak to the problems today. We look for signs of the light at the end of the tunnel:
- Most importantly, we have witnessed progress on the medical front. The evidence points to a slower pace of hospitalization and deaths. Treatments for Covid-19 are now in trials.
- One positive sign is that the number of jobless claims, a leading indicator, appears to have peaked and started to decline. Certainly, much restructuring is needed in the U.S. economy. That will take years, but the big shock has passed.
- We are looking for improvement in consumer and business sentiments. For the consumer, in the latest survey, we saw an upswing in consumer expectations as well as gains in consumer expectations for more jobs. Small business sentiment is released May 12th. We will see how business sentiment may have improved given federal financial assistance and the opening of some states.
- On the financial side, yield spreads between corporate and U.S. Treasury debt have declined signaling an improvement toward risk-taking in the market.
Of course, these are the indicators we follow each week, and each month we will update them for our clients and friends.
Quote of the Month
“The bottom” is the day before the recovery begins. Thus it’s absolutely impossible to know when the bottom has been reached…ever.
Howard Marks, Oaktree Capital
Chart of the Month
The information published herein is provided for informational purposes only, and does not constitute an offer, solicitation or recommendation to sell or an offer to buy securities, investment products or investment advisory services. All information, views, opinions and estimates are subject to change or correction without notice. Nothing contained herein constitutes financial, legal, tax, or other advice. The appropriateness of an investment or strategy will depend on an investor’s circumstances and objectives. These opinions may not fit to your financial status, risk and return preferences. Investment recommendations may change, and readers are urged to check with their investment advisors before making any investment decisions. Information provided is based on public information, by sources believed to be reliable but we cannot attest to its accuracy. Estimates of future performance are based on assumptions that may not be realized. Past performance is not necessarily indicative of future returns. The following indexes were used as proxies in the performance tables: Global Stocks = MSCI ACWI; U.S. Large Cap = S&P 500; U.S. Large Value = Russell 1000 Value; U.S. Large Growth = Russell 1000 Growth; U.S. Small Cap = Russell 2000; Int’l Dev Stocks = MSCI EAFE; Emerging Markets = MSCI EM; U.S. Inv Grade Bonds = Barclays U.S. Aggregate; U.S. High Yield Bonds = Barclays Corporate High Yield; Emerging Markets Debt = JPMorgan EMBI Global Diversified; Int’l Bonds = Barclays Global Treasury ex US; Cash = 3month T-Bill; Sector returns displayed in the chart represent S&P 500 sectors, while treasury benchmarks are from Barclays
Sources: CIC, Morningstar Direct, and The Leuthold Group
Chart of the Month
Quote of the Month
“The bottom” is the day before the recovery begins. Thus it’s absolutely impossible to know when the bottom has been reached…ever.
Howard Marks, Oaktree Capital
Trailing Returns