Market Perspectives June 2020
Capital Markets
By: Wade Austin
The “black swan event” for markets was turning off the U.S. economy like a switch in March, jolting equities into a bear market and the economy into a recession. Markets began to rebound in late March as declining virus fatality rates alleviated worst-case fears. In May, investors continued to dial up risk as low virus transmissions indicated a positive start to state economies reopening.
The effective launch of Federal Reserve relief facilities quickly stabilized fixed income markets. 10-Yr U.S. Treasury rates began the year at 1.92%, collapsed to 0.57% by late April, and may have bottomed exiting May at 0.65%. Credit sector spreads also tightened in May. Investment grade corporate bonds, municipal bonds, asset-backed securities, and high yield bond prices all rebounded during the month.
The S&P 500 posted a total return of 4.8% in May, entering June only 10.1% from its 2/19/20 all-time closing high. Equity market breadth was very encouraging as all 11 major sectors experienced total return gains for the month. Four of the 11 sectors closed up on a YTD basis, led by Technology at 7.3%. Value and small cap stocks often lead in durable advances out of a recession, so their recent surge is another positive sign.
The stock market may appear disconnected from current economic reality, and major issues remain unresolved. Yet, as noted in our April edition, equities rally in advance of a return to normal – the S&P 500 typically bottoms four months before a recession’s end. Like “black swans,” positive surprises (i.e., May’s job’s report) are also difficult to anticipate.
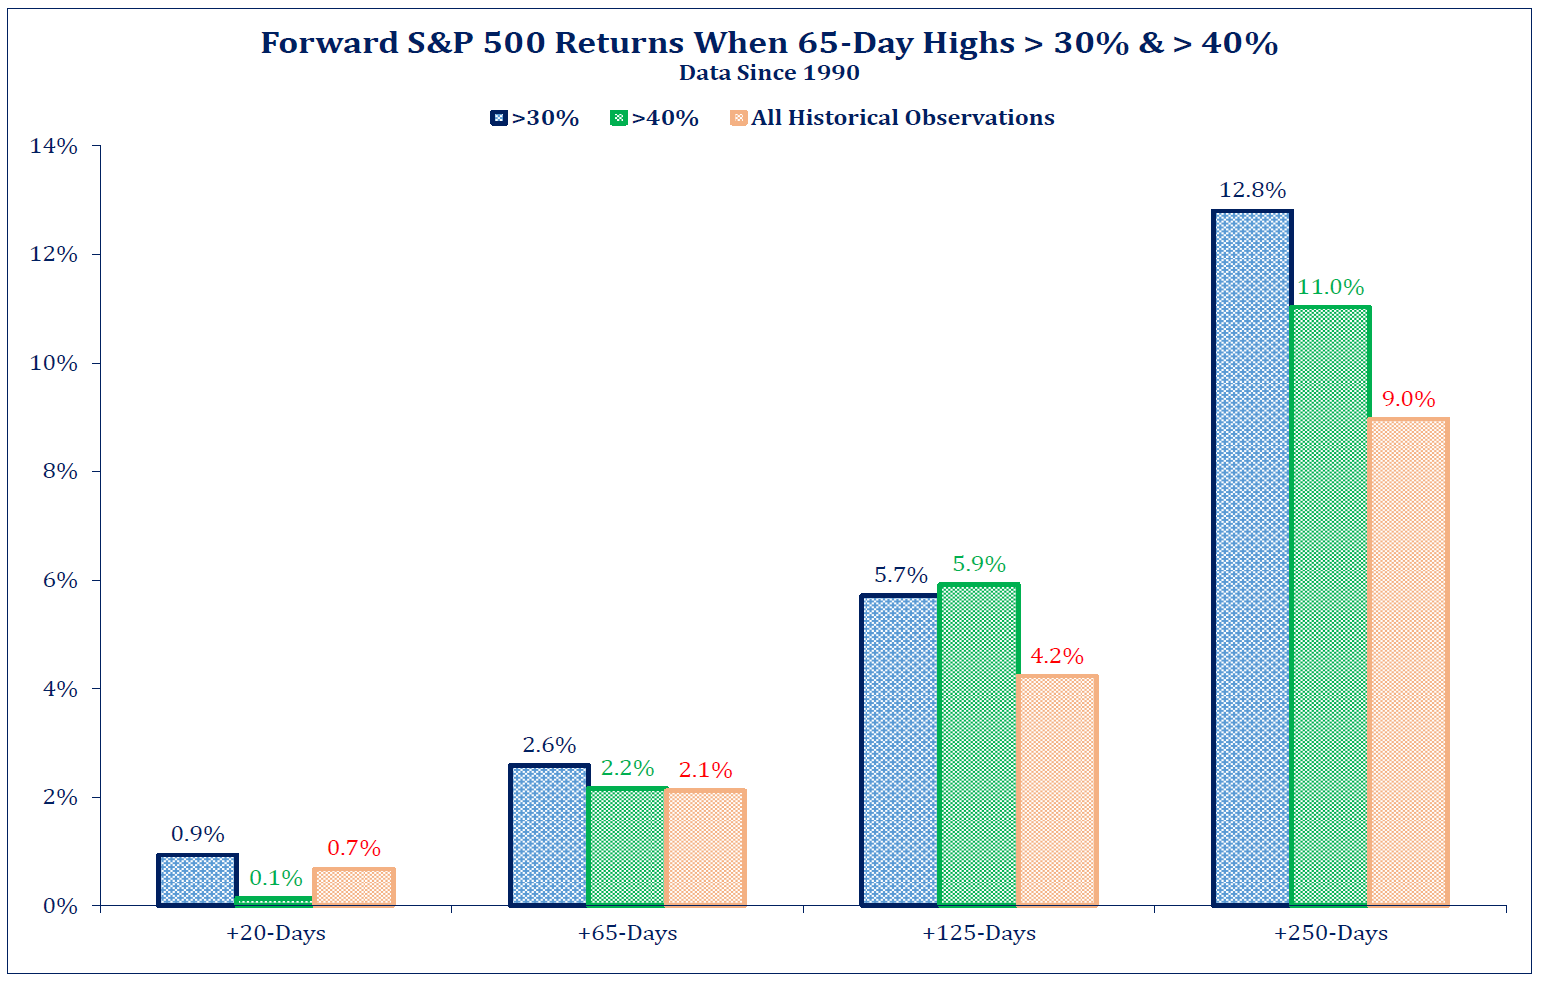
With equity markets racing towards recovery in early June, current valuations do point to overbought conditions and short-term caution. The percentage of S&P 500 stocks trading at their 3-month high reached 65% earlier this week, the highest reading in decades. While our Chart of the Month suggests that exceptionally strong momentum surges off bear market lows tend to be short-term choppy, their signals are longer-term (+6 and +12-months) bullish.
Insights by John Silvia, Director of Economics

“With the recession upon us, we must distinguish between the gloom today and the future economic recovery.” Such is how we began our note last month. Our view is the long view. We distinguish between leading economic and financial numbers and those numbers that indicate where we are today. By looking for signs of light at the end of the tunnel, our efforts have been rewarded with financial success.
- Progress on the medical front has opened the door for business openings. This is allowing businesses to recall workers hence the jump we recently witnessed.
- Jobless claims, a leading indicator, peaked, and the decline over the last eight weeks led us to be positive on the job market. We continue to follow jobless claims, along with other leading indicators such as consumer and business sentiment.
- On the financial side, yield spreads between corporate and U.S. Treasury debt have declined, while copper and oil prices have risen. All these indicators signal an improvement toward risk-taking in the market.
Yet, there is certainly much restructuring to be done in the U.S. economy which will take years, but the big shock has passed. The economy constantly evolves—there are new winners but also old losers. One has only to review the list of the Dow Jones 30 companies in 1960 or 1980 and compare that list to the list today.
Quote of the Month
“History provides a crucial insight regarding market crises: they are inevitable, painful and ultimately surmountable.”
Shelby M.C. Davis, founder – Davis Advisors
Chart of the Month
The information published herein is provided for informational purposes only, and does not constitute an offer, solicitation or recommendation to sell or an offer to buy securities, investment products or investment advisory services. All information, views, opinions and estimates are subject to change or correction without notice. Nothing contained herein constitutes financial, legal, tax, or other advice. The appropriateness of an investment or strategy will depend on an investor’s circumstances and objectives. These opinions may not fit to your financial status, risk and return preferences. Investment recommendations may change, and readers are urged to check with their investment advisors before making any investment decisions. Information provided is based on public information, by sources believed to be reliable but we cannot attest to its accuracy. Estimates of future performance are based on assumptions that may not be realized. Past performance is not necessarily indicative of future returns. The following indexes were used as proxies in the performance tables: Global Stocks = MSCI ACWI; U.S. Large Cap = S&P 500; U.S. Large Value = Russell 1000 Value; U.S. Large Growth = Russell 1000 Growth; U.S. Small Cap = Russell 2000; Int’l Dev Stocks = MSCI EAFE; Emerging Markets = MSCI EM; U.S. Inv Grade Bonds = Barclays U.S. Aggregate; U.S. High Yield Bonds = Barclays Corporate High Yield; Emerging Markets Debt = JPMorgan EMBI Global Diversified; Int’l Bonds = Barclays Global Treasury ex US; Cash = 3month T-Bill; Sector returns displayed in the chart represent S&P 500 sectors, while treasury benchmarks are from Barclays
Sources: CIC, Morningstar Direct, and The Leuthold Group
Chart of the Month
Quote of the Month
“History provides a crucial insight regarding market crises: they are inevitable, painful and ultimately surmountable.”
Shelby M.C. Davis, founder – Davis Advisors
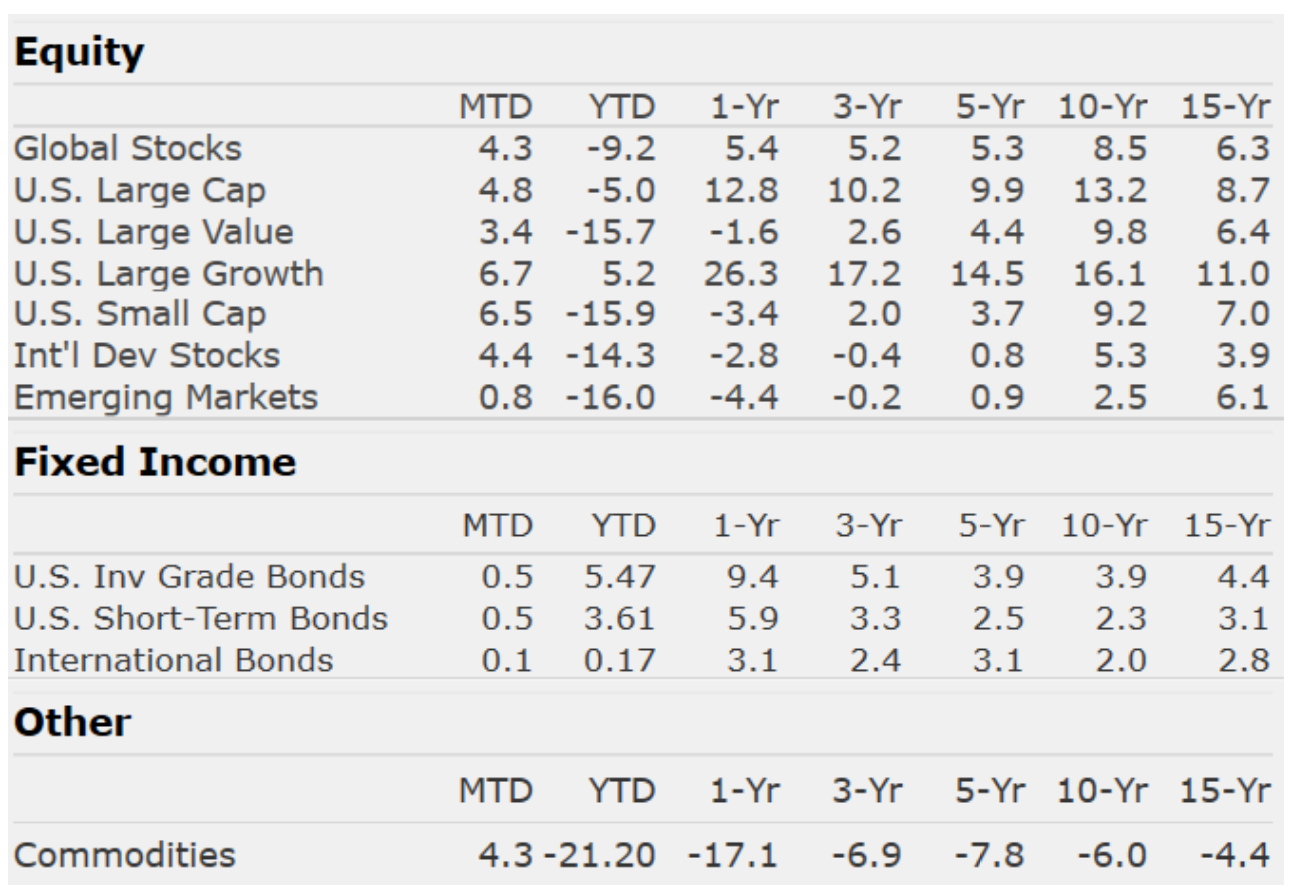
Trailing Returns