Market Perspectives – April 2020
Capital Markets
By: Wade Austin
The four most dangerous words in investing are said to be, “This time is different.” Yet today, “unprecedented” is clearly more factual than hyperbole. Markets have never experienced a recession by proclamation before.
We entered 2020 on a roll from last year’s 31% S&P 500 return and amid a record long U.S. economic expansion and bull market, full employment, and low inflation. Add in low interest rates and the phase one U.S.-China trade deal, and the tailwinds were brisk. Then suddenly, virus fears led to unimaginable quarantines and mitigation measures grounding the economy overnight.
Markets responded with the most volatile month on record. The VIX volatility index exploded faster and to higher levels than in 2008. From the Feb. 19th high to Mar. 23rd, stocks plunged 34% in a panic-fueled waterfall decline, the fastest to a bear market in history. Even safe-haven asset classes struggled during a two-week liquidity crisis caused by a mass dash for cash. The Fed swiftly cut the federal funds rate to near zero, injected $500B in new lending facilities and pledged unlimited quantitative easing as a bridge loan to stabilize capital markets until Congress’s bazooka-sized $2.2T fiscal stimulus could be passed.
Recent harsh economic data and shutdown duration concerns have shifted the consensus view from a V-shaped economic recovery to U-shaped. Yet despite the apocalyptic headlines, the S&P 500 enjoyed its 2nd best 5-day rally ever (+17%) through Mar. 30th. Containment and cure continue to be the focus as the world’s top biopharma scientists collaborate to develop and fast-track therapeutic and vaccine solutions.
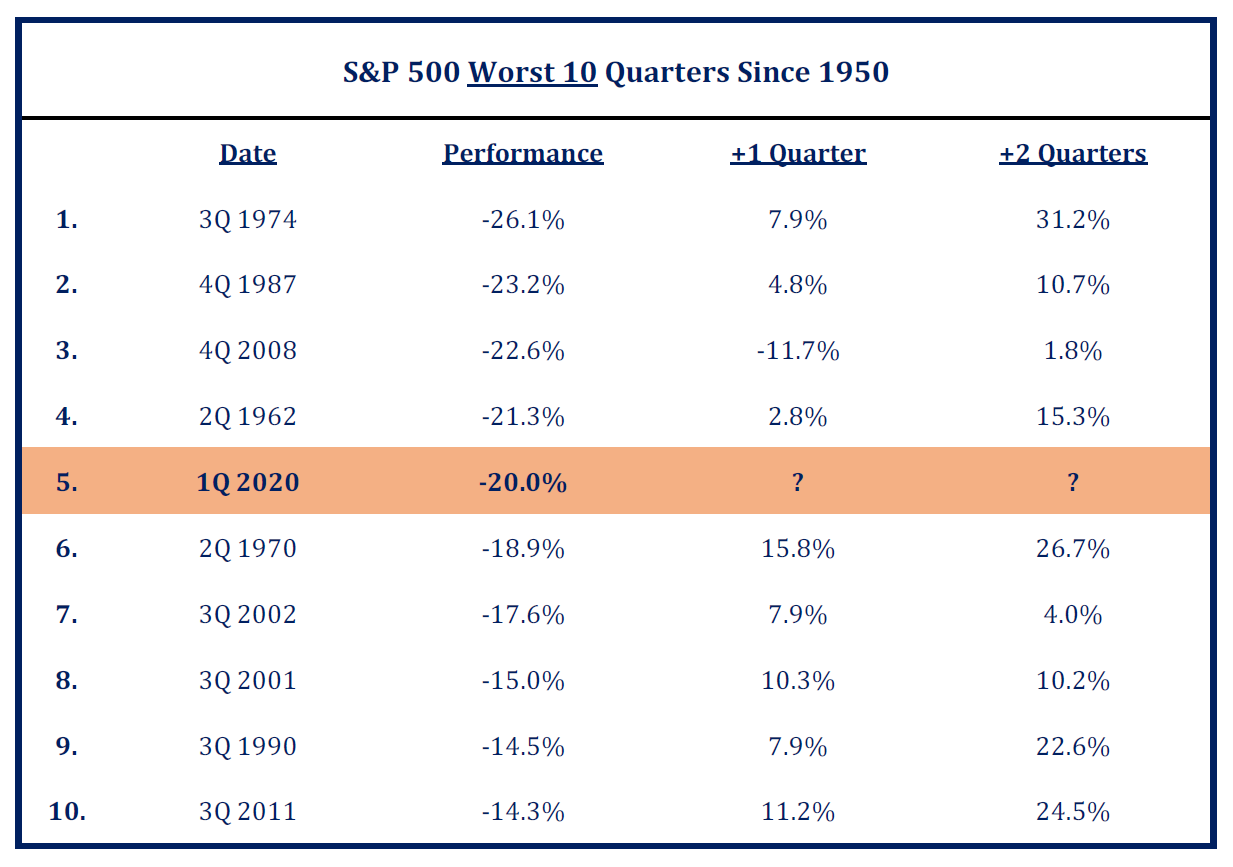
Optimism may sound naive, but America’s past suggests it pays to bet on human ingenuity. History reminds us the best years of stock market returns have followed truly terrible periods. Timing an exact low is improbable, but the S&P 500 bottoms four months prior and rises 24.9% before recessions end, on average. Disciplined, long-term investors have been rewarded for staying the course, even after the worst of quarters.
Insights by John Silvia, Director of Economics

Recessions and Cyclical Signals
Given recent, very negative jobs data, we face a deep recession with further negative reports on real economic growth, employment, retail sales and industrial production.
Where is the Upside?
We realize that so much depends on slowing the virus head count and, therefore, turning around both consumer and business attitudes. What are the signals we will look at as May, June and July roll around to indicate the upside to the economy? Let’s break this down into both real and financial indicators:
- Consumer sentiment and jobless claims are the benchmarks for the consumer. Watch for a recovery in consumer sentiment and a steady decline in jobless claims starting in May.
- As for business, we will follow new orders for consumer goods and business equipment.
- On the financial side, we will watch for a decline in the yield difference between corporate and U.S. Treasury debt. We should also see a rise in the difference between 10-year and 90-day U.S. Treasury securities.
Of course, these are the indicators we follow each week, and each month we will update them for our clients and friends.
Quote of the Month
“Time is your friend; impulse is your enemy.”
Jack Bogle, Vanguard founder
Chart of the Month
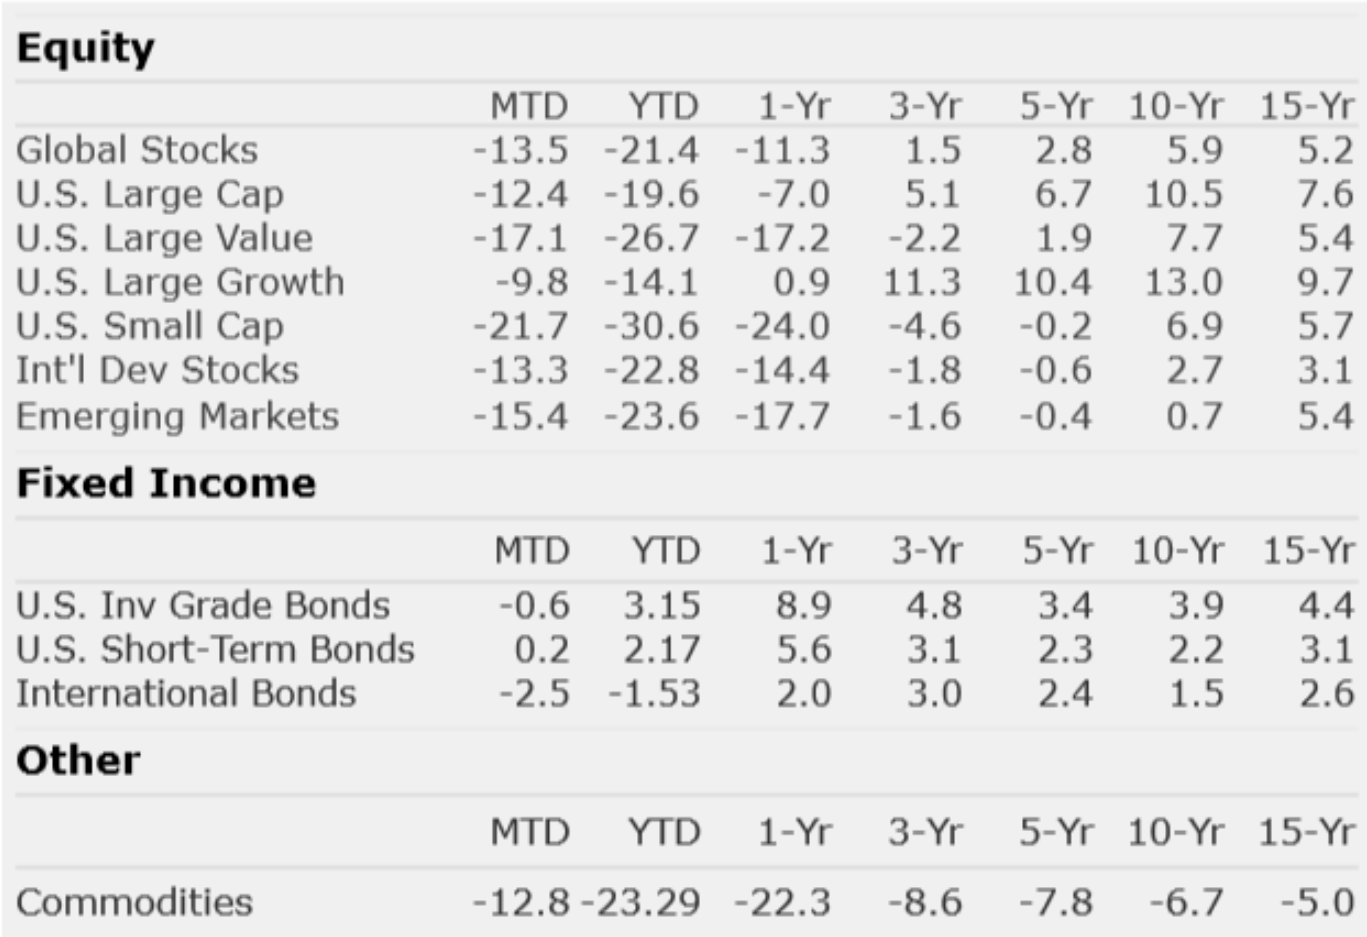
The information published herein is provided for informational purposes only, and does not constitute an offer, solicitation or recommendation to sell or an offer to buy securities, investment products or investment advisory services. All information, views, opinions and estimates are subject to change or correction without notice. Nothing contained herein constitutes financial, legal, tax, or other advice. The appropriateness of an investment or strategy will depend on an investor’s circumstances and objectives. These opinions may not fit to your financial status, risk and return preferences. Investment recommendations may change, and readers are urged to check with their investment advisors before making any investment decisions. Information provided is based on public information, by sources believed to be reliable but we cannot attest to its accuracy. Estimates of future performance are based on assumptions that may not be realized. Past performance is not necessarily indicative of future returns. The following indexes were used as proxies in the performance tables: Global Stocks = MSCI ACWI; U.S. Large Cap = S&P 500; U.S. Large Value = Russell 1000 Value; U.S. Large Growth = Russell 1000 Growth; U.S. Small Cap = Russell 2000; Int’l Dev Stocks = MSCI EAFE; Emerging Markets = MSCI EM; U.S. Inv Grade Bonds = Barclays U.S. Aggregate; U.S. High Yield Bonds = Barclays Corporate High Yield; Emerging Markets Debt = JPMorgan EMBI Global Diversified; Int’l Bonds = Barclays Global Treasury ex US; Cash = 3month T-Bill; Sector returns displayed in the chart represent S&P 500 sectors, while treasury benchmarks are from Barclays
Sources: CIC, Morningstar Direct, and The Leuthold Group
Chart of the Month
Quote of the Month
“Time is your friend; impulse is your enemy.”
Jack Bogle, Vanguard founder
Trailing Returns