Market Perspectives June 2023
Capital Markets
By: Wade Austin
While the debt ceiling drama in Washington dominated national news, Mr. Market mostly ignored the noisy negotiations assuming the perils from 2011 were too fresh in Congress’ mind to risk repeating. The S&P 500 eked out a fractional gain in May, extending the positive momentum to its surprisingly strong start this year. Despite persistent and substantial headwinds, including sticky inflation, unwavering recession prognostications, geopolitical tensions, and the political turmoil, global equity markets have climbed the proverbial “wall of worry” since bottoming last October.
In reflecting back to January 1st, investor sentiment was overwhelmingly bearish. Contrarian reversals often occur when the consensus view becomes too one-sided. Three big surprises also contributed to this year’s equities rebound:
- The softness in energy prices helped to lower corporate expenses and increase consumer spending.
- China reopened sooner than expected, boosting the global economic recovery. European luxury goods providers were the biggest beneficiary.
- No one had heard of Chat GPT back in December. Emerging, exuberant AI narratives have more recently powered a strong tailwind for select mega-cap tech and growth stocks.
The move to new recovery highs has been extraordinarily narrow since the mini-banking crisis first jolted markets. The data illustrating the lack of market breadth is remarkable. The S&P 500’s ten largest stocks by market weight accounted for 95.1% of the index’s gain, far exceeding the prior record high of 78.7% in 2007. Amazingly, only eight stocks accounted for more than 100% of the U.S. large-cap index’s gains, meaning the other 492 stocks have been a collective loser. This year’s so-called “Magnificent Seven” are Apple, Microsoft, Amazon, NVIDIA, Alphabet (GOOGL and GOOG), Meta, and Tesla. However, after last year’s brutal tech selloff, only NVIDIA has recovered to all-time highs as of the end of May.
During May, if it wasn’t an AI or Tech stock, its price went down. While the traditional cap-weighted S&P 500 gained 0.4% in May, the equal-weighted S&P 500 was down 3.8%. On a YTD basis, the S&P 500 has advanced 9.6%, yet the equal-weighted S&P 500 is down 0.7%. On a sector basis, just three of eleven (Technology, Communication Services, and Consumer Discretionary) posted gains in May. The other eight sectors were down an average of 5%. Energy, the laggard, declined 10.0%.
For the same reasons, growth stocks have trounced value. While growth stocks are up 20.8% YTD, value stocks have declined 1.4%. Small-cap stocks continue to lag as well and are flat YTD. International stocks, which had been leading the S&P 500 through April, also lost steam in May but still produced a healthy YTD gain of 6.8%. Mexico (+20.3%) is the world leader this year due to U.S. nearshoring efforts to reduce their supply chain dependencies on China.
Bonds retreated in May upon economic releases that revealed a resilient labor market, sticky inflation, and continued economic growth. With the 10-year Treasury yield rising 23 bps to 3.65%, the U.S. aggregate bond index declined 1.1%. Although all fixed income sectors fell during May, they have each posted gains for the year. Given the U.S. economy’s unexpected resilience this year, it’s no surprise, in hindsight, that high-yield bonds (+3.6%) have been the top YTD performer.
With the stock market rally approaching eight months off October’s lows, we are well beyond the previously longest bear market rally (5 months). The S&P 500 is within a whisker of officially entering a new bull market, yet some of the most reliable recession indicators are still flashing red. Bears are quick to point out that a healthy bull market requires much broader leadership than currently exists.
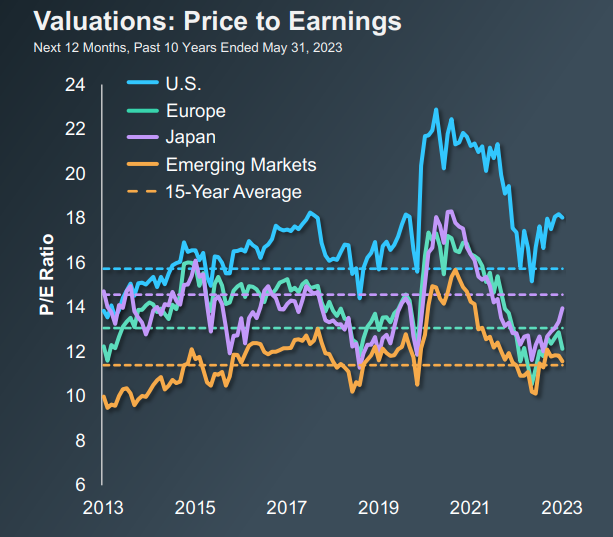
Further, many analysts caution that prices appear to have become disconnected from fundamentals. As illustrated in our Chart of the Month, the S&P 500 is currently trading with a forward P/E ratio of 18x vs. its historical average of 15.6x. Foreign stocks are priced at much cheaper valuations, while U.S. small-cap stocks are trading at 2008 level discounts relative to the S&P 500.
There are three likely scenarios for equity markets going forward. Will the laggards (value and small-cap stocks) rally and catch up? Will the NASDAQ eventually succumb to the lagged effects of the Fed’s rapid rate hikes? Will the winners and losers further separate? This conundrum is the primary crosscurrent investors are facing. Weaker economic growth lies ahead for many companies. But on the other hand, the growth prospects for AI are enormous and could help prevent a recession.
Generative AI is the bullish case with the current frenzy reminiscent of the 1998 stage of the internet boom. AI is creating an arms race like Y2K spending back then. Currently, large, well-positioned hardware and software companies are getting stronger. The promise of AI is that the productivity gains resulting from new products and services will be profitable for many companies. As during the dot-com era, some companies will benefit tremendously from the coming innovation (i.e., Amazon, Google, Apple), while others will be harshly disrupted (Sears, AOL, Blackberry). For long-term investors who can stomach heightened volatility, we recommend staying invested and diversified.
Insights by John Silvia, Director of Economics

Last Friday’s employment report creates a challenge for investors. Until the strong jobs report, the market sentiment was that the Fed would pause in June to await further evidence of the impact of past rate hikes. But the May jobs report does not show much impact, especially given the upward revision of jobs for the prior two months. For investors, the problem of valuation comes to the floor as rates rise in the face of slower economic growth/profits in 2023. Given Fed commentary, we suspect the Fed will pause in June.
- For investors, the long-run outlook also remains a challenge. According to the University of Michigan consumer sentiment survey, 5-year inflation expectations have risen to 3.2% from 2.9% in January. Five-year Treasury rates have increased from 2.9% to 3.7% over the last twelve months. Our view is that the economy has moved to a higher regime for inflation and interest rates, and there is no return to the 2012-2019 period.
- In May, job gains were 339,000, above the last three-month average of 283,000. Job gains were solid in construction and private services. These job gains bring into question how much higher interest rates impact the economy. Average hourly earnings also slowed at a pace of 4.0% over the past three months compared to 4.3% over the past year.
- Meanwhile, the unemployment rate rose to 3.7% from 3.5% compared to three months ago. This bump may reflect a seasonal adjustment problem as teenage unemployment jumped as the school year ended.
- Persistent inflation above what the Fed and markets anticipated remains a driving force for policy and the financial markets. The Atlanta Fed sticky price inflation measure, at 6.3%, signals a valuation problem for assets priced to lower inflation/interest rates. As a benchmark, the terminal federal funds rate for December 2023 is 5.125% compared to below 1% readings for 2020-2022.
- Inflation benchmarks remain disappointing. The core PCE deflator rose 4.3% over the last three months, below 4.7% over the previous twelve months. The Fed’s super core inflation measure registered 4.3% in the previous three months, in contrast to the 4.5% pace over the last twelve months. Inflation progress will continue, but the pace of inflation declines bringing into question how many more interest rate increases will be necessary.
- For investors and the Fed, leading indicators of inflation, such as the Price Pressures Measure from the St. Louis Fed, hint at inflation moderation but not at a pace quick enough to satisfy the Fed’s inflation targets for 2023/2024. The case for further Fed rate increases ahead and for “higher for longer” interest rate levels remain in place.
- In contrast, the 10- and 2-year Treasury rates did rally in recent months on the expectation that the Fed will indeed ease policy in the second half of this year in response to the banking problems. However, the rally was short-lived. Rates in June are right back to pre-banking problem levels.
- The U.S. dollar has reversed course once again as market expectations of a Fed policy ease and slower growth have reversed. The volatility in the dollar’s value reflects the volatility of inflation and interest rate expectations. Here is another market where the resolution of differing expectations will mean volatility in market prices.
- Higher interest rates are having an impact, as evidenced by the slowdown of new orders and shipments of durable goods and, thereby, business investment.
- In contrast, consumer spending remains positive, and new home sales have risen over the past three months as mortgage rates dipped from prior highs. The strength of the consumer has sustained the economic expansion.
- Corporate profits remain a challenge for investors. After-tax, nonfinancial domestic profits fell in the first quarter of 2023 and are down year over year. The continued rise in unit labor costs for businesses has impacted realized profits and expectations going forward. For equity investors, this is a hit on top-line revenue, slower real final sales, and bottom-line unit labor costs.
- U.S. financial markets continue to adjust to the economic reality of moderate growth, higher interest rates, and lower profit expectations for the year ahead.
- For international investors, sovereign debt fundamentals have deteriorated (slower economic growth, higher interest rates) for many countries, such as Italy, and especially for emerging markets. Economic growth in the Eurozone and the U.K. remains disappointing, as does the gain in China after reopening.
Quote of the Month
“We always overestimate the change that will occur in the next two years and underestimate the change that will occur in the next ten.”
Bill Gates – American Business Magnate and Co-founder of Microsoft
Chart of the Month
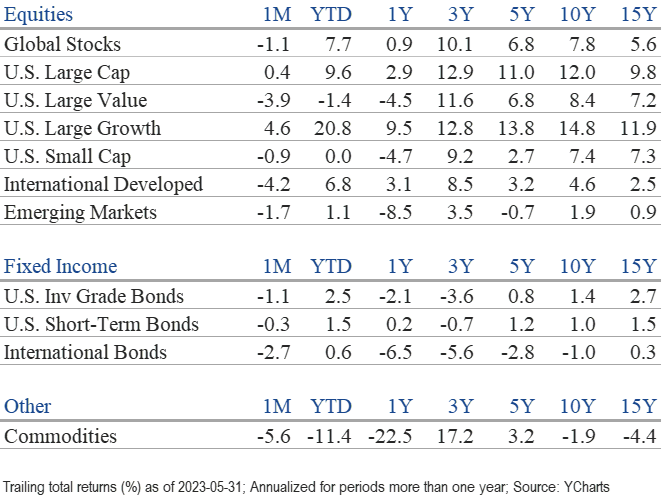
The information published herein is provided for informational purposes only, and does not constitute an offer, solicitation or recommendation to sell or an offer to buy securities, investment products or investment advisory services. All information, views, opinions and estimates are subject to change or correction without notice. Nothing contained herein constitutes financial, legal, tax, or other advice. The appropriateness of an investment or strategy will depend on an investor’s circumstances and objectives. These opinions may not fit to your financial status, risk and return preferences. Investment recommendations may change, and readers are urged to check with their investment advisors before making any investment decisions. Information provided is based on public information, by sources believed to be reliable but we cannot attest to its accuracy. Estimates of future performance are based on assumptions that may not be realized. Past performance is not necessarily indicative of future returns. The following indexes were used as proxies in the performance tables: Global Stocks = MSCI ACWI; U.S. Large Cap = S&P 500; U.S. Large Value = Russell 1000 Value; U.S. Large Growth = Russell 1000 Growth; U.S. Small Cap = Russell 2000; Int’l Dev Stocks = MSCI EAFE; Emerging Markets = MSCI EM; U.S. Inv Grade Bonds = Barclays U.S. Aggregate; U.S. High Yield Bonds = Barclays Corporate High Yield; Emerging Markets Debt = JPMorgan EMBI Global Diversified; Int’l Bonds = Barclays Global Treasury ex US; Cash = 3month T-Bill; Sector returns displayed in the chart represent S&P 500 sectors, while treasury benchmarks are from Barclays
Source: Schwab Center for Financial Research with data provided by Morningstar, Inc., as of 3/31/2022. Asset class performance represented by annual total returns for the following indexes: S&P 500® Index (US Lg Cap), Russell 2000® Index (US Sm Cap), MSCI EAFE® Net of Taxes (Int’l Dev), MSCI Emerging Markets IndexSM (EM), MSCI US REIT Index (REITs), S&P GSCI® (Comm.), Bloomberg Barclays U.S. Treasury Inflation-Linked Bond Index (TIPS), Bloomberg Barclays U.S. Aggregate Bond Index (Core US Bonds), Bloomberg Barclays U.S. High Yield Bond Index (High Yield Bonds), Bloomberg Barclays Global Aggregate Ex-USD TR Index (Int’l Dev Bonds), Bloomberg Barclays Emerging Markets USD Bond TR Index (EM Bonds), FTSE U.S. 3-Month T-Bill Index (T-Bills). Past results are not an indication or guarantee of future performance. Returns assume reinvestment of dividends, interest, and capital gains. Indexes are unmanaged, do not incur fees or expenses, and cannot be invested in directly.
Chart of the Month: T. Rowe Price
Chart of the Month
Quote of the Month
“We always overestimate the change that will occur in the next two years and underestimate the change that will occur in the next ten.”
Bill Gates – American Business Magnate and Co-founder of Microsoft
Trailing Returns