Market Perspectives April 2023
Capital Markets
By: Wade Austin
Although fans of Tobacco Road teams were disappointed with this year’s results, the men’s and women’s NCAA basketball tournament once again delivered March Madness, spiced with tense moments and numerous upsets. For the first time, none of the men’s number one seeds advanced to the Elite Eight. Investors faced a more eventful and consequential version of March Madness as an unexpected mini-banking crisis and mixed economic data stressed financial markets. Unlike the tournament results, the corporate heavyweights (led by market cap leaders Apple, Microsoft, and Nvidia) prevailed by month’s end.
The first quarter was a bumpy ride with multiple lead changes for equities and bonds. Reacting to encouraging inflation data in January, both started the year fast, with the S&P 500 gaining 8.9% by early February and the 10-year U.S. Treasury yield falling 87 basis points from its November peak by mid-January. Momentum faded in February as inflation appeared stubbornly persistent despite the Federal Reserve’s monetary pressures. Stocks and bonds relinquished much of their January returns by the end of February.
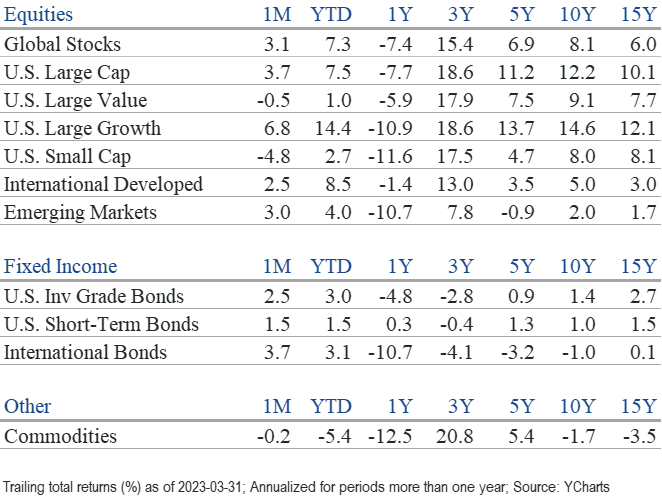
The markets’ struggles continued into March, culminating mid-month with the failures of Silicon Valley Bank, Signature Bank, and Credit Suisse. As the clock wound down on the quarter, confidence started to rebuild in response to a favorable call (intervention) by the Fed, FDIC, and U.S. Treasury Department. Both markets finished strong, with the S&P 500 rallying 3.7% and the Bloomberg U.S. Aggregate bond index 2.5% in March.
The S&P 500 ended Q1 posting a solid 7.5% return. However, performance was bifurcated, as best exhibited by comparing the results of the NASDAQ +17.0% vs. the DJIA +0.8% and Russell 1000 growth +14.3% vs. R1000 value +0.8%. In a dramatic reversal from 2022, the Q1 winners on a sector basis (technology +20.1%, communication services +18.0%, and consumer discretionary +13.2%) posted the most painful losses last year. Conversely, this quarter’s laggards (financials -6.6%, health care -5.4%, energy -5.3%, and utilities -4.0%) protected capital the best during last year’s selloff.
Small-cap stocks were most harmed by the mini-banking crisis, falling 4.8% in March. Anxious bank depositors moved accounts to the largest banks and significant dollars flowed into higher yielding Treasuries and money market funds. As a result, investors anticipated that smaller companies will be more affected by the ensuing credit crunch.
The biggest surprise for most U.S. investors has been the outperformance of developed international stocks over the past six months (MCSI EAFE +27.5% vs. S&P 500 +15.6%). Last summer, the economic outlook for Europe was bleak, fearing winter during a severe energy shortage. Their fortunes reversed after a mild winter, plunging natural gas prices, and a weakening U.S. dollar.
March 16, 2023 marked the 1st anniversary of the Fed’s current tightening cycle. After nine consecutive rate increases, the Fed Funds rate (upper bound) increased from 0.25% to 5.0%. The Bloomberg U.S. Aggregate index began the year with a -9.9% return since the first hike. After a roller coaster Q1 for yields concluded with a flight to quality, sparked by the banking troubles, the bond index ended the quarter with a solid 3.0% total return. All fixed income sectors posted positive returns led by high yield bonds +3.6%, U.S. investment grade bonds +3.5%, and U.S. Treasuries +3.0%.
After posting stellar returns the past two years, the Bloomberg commodities index struggled in Q1, declining 6.4%. Meanwhile, gold has surged over the past six months and reached an all-time monthly closing high of $1,966 to end March. Gold gained 8.4% in Q1 and crested $2,000 in the first week of April. Since the market low last October, gold (GLD) has outperformed the S&P 500 (+21.0 % vs. +14.3%). It is very unusual for gold to be this dominant over stocks at six months off major S&P 500 bottoms.
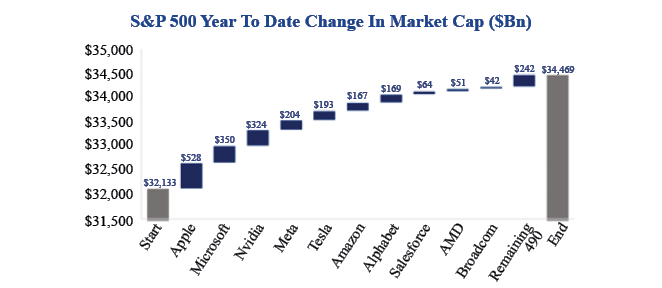
Indeed, equity markets have been sideways and choppy for the past year. The S&P 500 has been chiefly range bound between 3,800 and 4,200. Going forward, a concern for U.S. equity markets is the top-heavy outperformance within the S&P 500. A healthy market typically has broader leadership. As detailed in our Chart of the Month, only ten stocks accounted for 90% of the S&P 500’s YTD market cap gains through March. Profitable technology companies have performed well during 3 of the past 4 recessions, while less inflation and lower rates favor growth stocks. The market appears to be anticipating these conditions in spite of the Fed’s continued “higher for longer” rate projections. With Q1 earnings season kicking off Friday and another important Fed meeting in May, Q2 may be a pivotal juncture for markets.
Insights by John Silvia, Director of Economics
Last Friday’s employment report reinforces the view that the Fed will raise its policy rate in early May-even as leading indicators hint that growth for inflation and the economy are slowing down. For investors, the valuation problem comes to the floor as rates rise in the face of slower economic growth/profits in 2023.
- Over the longer run, investors must evaluate the issue of transition. Are we entering a higher regime for inflation and interest rates? Or, will we return, over time, to the lower inflation/interest rate environment of the 2012-2019 period? We believe there is no return to the 2012-2019 period.
- In March, job gains were 236,000, below the last three-month average of 345,000. Slower job gains were noted in construction, education & health, and leisure employment. Average hourly earnings also slowed at a pace of 4.2% over the past three months compared to 5.1% over the past year.
- Yet, the unemployment rate held steady at 3.5% compared to three months ago. For the Fed, this signals that the labor market remains tight.
- Expectations of inflation remain another driving force for policy and the financial markets. Over the past year, the persistence of inflation at a higher rate than the Fed and the financial markets expected has prompted a continual but sporadic upward move in expectations for a terminal federal funds rate and the revaluation of the “higher for longer” persistence of interest rates.
- Inflation benchmarks remain disappointing. The core PCE deflator rose 4.9% over the last three months, above 4.6% in the previous twelve months. There was no deceleration of inflation. Even worse, the Fed’s super core inflation measure accelerated over the last three months at a 4.8% pace compared to the 4.6% pace during the previous twelve months.
- For investors and the Fed, leading indicators of inflation, such as the St. Louis Fed’s Price Pressures Measure, suggest modest inflation moderation but not at a pace quick enough to satisfy the Fed’s inflation targets for 2023/2024. The case for another Fed rate hike in May and a “higher for longer” interest rate level remains in place.
- In contrast, the 10- and 2-year Treasury rates have rallied on the expectation that the Fed will ease policy in the second half of this year. Therefore, a gap between market expectations and Fed intentions exists. The bond market is pricing in Fed Funds futures below 4.5% by the end of the year, in stark contrast to the Fed’s target of 5.1%.
- The resolution of such differences will contribute to financial market volatility in the second half of 2023.
- The U. S. dollar has reversed course once again as market expectations of a Fed policy ease and lower inflation have reasserted themselves. The fluctuations in the dollar’s value reflect the volatility of inflation and interest rate expectations. The resolution of these differing expectations will drive volatility in market prices.
- Higher interest rates are having an impact, as evidenced by the slowdown of new orders and shipments of durable goods.
- In contrast, existing and new home sales have risen over the past three months as mortgage rates dipped from prior highs. The strength of the consumer reappeared as mortgage rates fell, and such resilience has sustained the economic expansion.
- Corporate profits remain a challenge for investors. Non-financial domestic profits fell in the fourth quarter. The continued rise in unit labor costs has impacted realized profits and expectations going forward. As the outlook for corporate profits has deteriorated, some analysts forecast an outright decline in pre-tax earnings in the year ahead.
- U.S. financial markets continue to adjust to the economic reality of moderate growth and higher interest rates but lower profit expectations for the year ahead.
Quote of the Month
“The world is full of foolish gamblers, and they will not do as well as the patient investor.”
Charlie Munger – American Investor, Businessman, and Vice Chairman of Berkshire Hathaway
The information published herein is provided for informational purposes only, and does not constitute an offer, solicitation or recommendation to sell or an offer to buy securities, investment products or investment advisory services. All information, views, opinions and estimates are subject to change or correction without notice. Nothing contained herein constitutes financial, legal, tax, or other advice. The appropriateness of an investment or strategy will depend on an investor’s circumstances and objectives. These opinions may not fit to your financial status, risk and return preferences. Investment recommendations may change, and readers are urged to check with their investment advisors before making any investment decisions. Information provided is based on public information, by sources believed to be reliable but we cannot attest to its accuracy. Estimates of future performance are based on assumptions that may not be realized. Past performance is not necessarily indicative of future returns. The following indexes were used as proxies in the performance tables: Global Stocks = MSCI ACWI; U.S. Large Cap = S&P 500; U.S. Large Value = Russell 1000 Value; U.S. Large Growth = Russell 1000 Growth; U.S. Small Cap = Russell 2000; Int’l Dev Stocks = MSCI EAFE; Emerging Markets = MSCI EM; U.S. Inv Grade Bonds = Barclays U.S. Aggregate; U.S. High Yield Bonds = Barclays Corporate High Yield; Emerging Markets Debt = JPMorgan EMBI Global Diversified; Int’l Bonds = Barclays Global Treasury ex US; Cash = 3month T-Bill; Sector returns displayed in the chart represent S&P 500 sectors, while treasury benchmarks are from Barclays
Source: Schwab Center for Financial Research with data provided by Morningstar, Inc., as of 3/31/2022. Asset class performance represented by annual total returns for the following indexes: S&P 500® Index (US Lg Cap), Russell 2000® Index (US Sm Cap), MSCI EAFE® Net of Taxes (Int’l Dev), MSCI Emerging Markets IndexSM (EM), MSCI US REIT Index (REITs), S&P GSCI® (Comm.), Bloomberg Barclays U.S. Treasury Inflation-Linked Bond Index (TIPS), Bloomberg Barclays U.S. Aggregate Bond Index (Core US Bonds), Bloomberg Barclays U.S. High Yield Bond Index (High Yield Bonds), Bloomberg Barclays Global Aggregate Ex-USD TR Index (Int’l Dev Bonds), Bloomberg Barclays Emerging Markets USD Bond TR Index (EM Bonds), FTSE U.S. 3-Month T-Bill Index (T-Bills). Past results are not an indication or guarantee of future performance. Returns assume reinvestment of dividends, interest, and capital gains. Indexes are unmanaged, do not incur fees or expenses, and cannot be invested in directly.
Chart of the Month: Strategas


