Market Perspectives June 2022
Capital Markets
By: Wade Austin
Investors were relieved to eke out modest gains in broad stock and bond indices in May after yet another extremely volatile month for capital markets. Escalating recession concerns and corporate profit warnings contributed to the increasingly dour sentiment among investors, consumers, and some CEOs.
After Target and Walmart CEOs warned they had added too much inventory and too many employees, markets tumbled further. The S&P 500 briefly dipped into bear market territory in morning trading on May 20th before rallying in the session’s final hours, sparking a sudden 9% late-month rally. To that point, the Dow Jones Industrial Average had declined 8 straight weeks. The unrelenting losing streak was its longest in over 100 years.
There was not a specific catalyst that sparked the rebound, although elevated corporate insider buying and Broadcom’s announced acquisition of VMware were two encouraging signals that stocks had, at least momentarily, reached oversold conditions. The stocks that have been punished the most this year (technology and growth) outperformed during the rebound off the year’s bottom.
The S&P 500’s 0.2% gain in May masked a significant 12-percentage point intra-month swing. Each day traded with at least a 1% price swing. Small-cap and emerging market stocks experienced even larger 16-point intra-month swings before finishing the month with slight gains.
By narrowly averting an official bear market (which is based on closing day prices) the S&P 500 avoided a nasty distinction. The U.S. large-cap index has never entered a bear market without experiencing at least one correction beforehand. However, other major U.S. equity indices did not escape the bear’s grasp. The Russell 2000 (small-caps) and NASDAQ reached 52-week drawdowns of -29% and -30%, respectively, during the month.
Within the S&P 500, six of the eleven major sectors were up on a total return basis in May led by energy (+15.8%). Real estate, consumer discretionary, and consumer staples sectors were the laggards, declining approximately 5% each. The S&P energy sector has surged 58% YTD and may be short-term overbought. However, the sector only comprises 5% of the overall S&P 500 index, which is substantially less than its all-time high level of 27% in 1980.
Bond yields finally settled down in May in tandem with stocks’ rally. The 10-year U.S. Treasury yield began the year at 1.52% but doubled by early May. The benchmark yield surged above 3% (for the first time since November 2018) in anticipation of the Fed’s first 50 bps rate hike in 22 years. With increasing concerns about slowing economic growth, yields then drifted lower before closing the month at 2.85%, 9 bps below its yield on April 30th.
After four months of negative returns, all major fixed income sectors posted gains in May. The U.S. aggregate bond index gained 0.64%, while municipal bonds (+1.5%) were the best performing fixed income sector. With the U.S. aggregate bond index off 8.9% YTD, bonds continue their worst annual start in decades.
The current list of complex headwinds is worrisome and makes economic and corporate outlooks especially difficult. We know stocks have priced in a lot of bad news but also feel risk-on signals have not yet been triggered. Relief rallies are not uncommon. The average bear market rally bounces 15% and lasts two months before succumbing to further weakness.
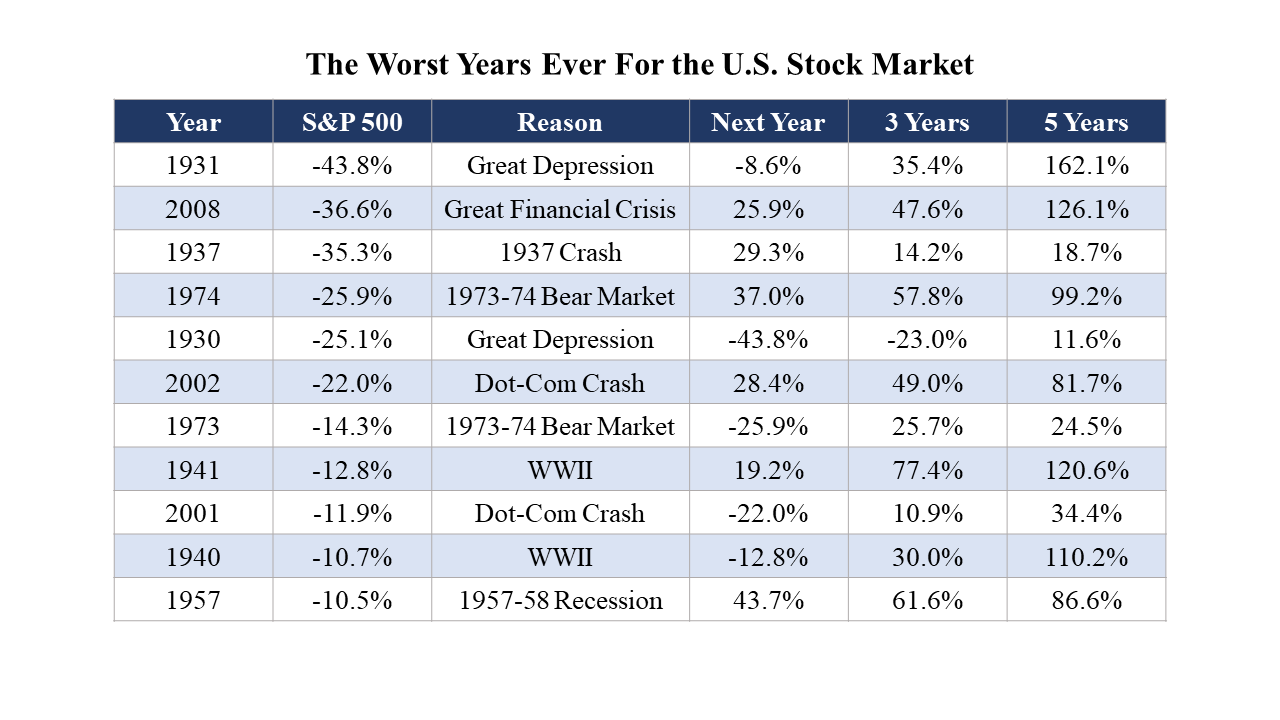
If the S&P 500 were to end 2022 at current levels (-13%), it would mark only its 12th year with double-digit declines and rank as the 8th worst since 1928. Even if stocks retest their May lows, a silver lining is that forward returns after bad years have been above average. Our Chart of the Month lists the 1-, 3-, and 5-year total returns after the 11 worst years for U.S. stocks. The forward 1-year returns averaged a modest 6.4%, but the 3- and 5-year average forward returns have been stellar (35% and 80%, respectively). It may be a healthy reminder that adherence to disciplined diversification and periodic rebalancing has enabled patient investors to weather market storms and participate in the inevitable good periods that follow.
Insights by John Silvia, Director of Economics

For investors, the first half of this year has been a story of transitions. The year 2021 was a period of rapid economic growth, modest inflation, steady monetary policy, and an absence of a major military conflict. The year 2022 has been none of that.
Transition periods occur when the assumptions that underlie our investment strategies – economic growth, inflation, interest rates, and global relations – are significantly altered. Even more so, there is no sense of stabilization in the outlook for these four factors.
- For the linkage between economic growth and corporate earnings, expectations of the pace of growth have been downshifted. A debate between slow growth and recession has now taken center stage.
- Our leading economic indicators, such as jobless claims, building permits, and capital goods orders signal a slowdown. However, there is no clear signal of stabilization in these indicators and hence no sense of the pace of growth going forward. This uncertainty plays into the problem of valuation for equities and corporate debt that rely upon profits to provide value.
- Moreover, investor uncertainty remains prominent when deciphering the pace of growth/profits to be discounted in market prices. Since the start of the year, expectations on growth/profits have been regularly lowered thereby creating the uncertainty that we see in market volatility.
- Inflation has surprised both in terms of its level and its persistence. While core PCE inflation, the target of Fed policy, came in at 4.0% for the last three months, this pace is significantly above the Fed’s target of 2%. There is more to go before the Fed declares victory over inflation. Moreover, the level of this inflation benchmark has been revised upward since the beginning of the year.
- Inflation in commodity and home prices has also introduced a question of portfolio allocation. When real assets such as housing are still delivering double-digit price increases, then the attractiveness of this asset class improves relative to equities in a way, not apparent last year. Also, for commodities such as oil, natural gas, and wheat, the attractiveness of alternatives outside the equity/bond/cash universe becomes apparent.
- As for interest rates, the parameters of slower growth but high inflation create a particular challenge for investors. Shall we anticipate that central banks, such as the Fed, the Bank of Canada, or the Bank of England will continue to raise interest rates even as their economies slow? What is the balance between the targets of sustained growth/employment and lower inflation for each of these central banks? What is the end game for policy rates? As investors, we must estimate a final interest rate to discount future earnings, but we also recognize that even central banks do control all events.
- Our outlook is that the Fed, Bank of Canada, and the Bank of England will continue to raise benchmark policy rates at least another 100 basis points implying further increases in the U.S. Treasury benchmark 2-year, 5-year, and 10-year interest rates.
- At this point, commentators have interpreted an inverted yield curve as a signal of a recession ahead. Yet, corporate bond spreads have not widened significantly, and leading indicators still signal economic growth over the next six months. We currently do not have a recession in our forecast.
- A twist in the outlook that may be of interest is that the higher yields on sovereign and corporate debt may now offer an investment return more competitive with equities than in prior years.
- The conflict between Russia and Ukraine continues to have pervasive impacts on economic growth, profits, and inflation, particularly for international investors. European growth expectations have been hit hard and inflation in Europe is far above earlier year expectations. At this point, a recession in Europe and accompanying disappointing earnings are in prospect.
- Therefore, the outlook remains for modest economic growth in 2022 (certainly below the pace of 2021) and persistent above Fed target inflation. Thereby, the Fed will increase policy rates in both June and July.
The evolution of economic fundamentals over the past six months calls for a thoughtful evaluation of our portfolios. The economic outlook, inflation, and interest rates in 2022 and 2023 will not be a repeat of 2021 and will be more challenging for investors. Constant awareness of economic and political developments is necessary for thoughtful portfolio management.
Quote of the Month
“I’ve lived through some terrible things in my life, some of which have actually happened.”
Mark Twain
Chart of the Month
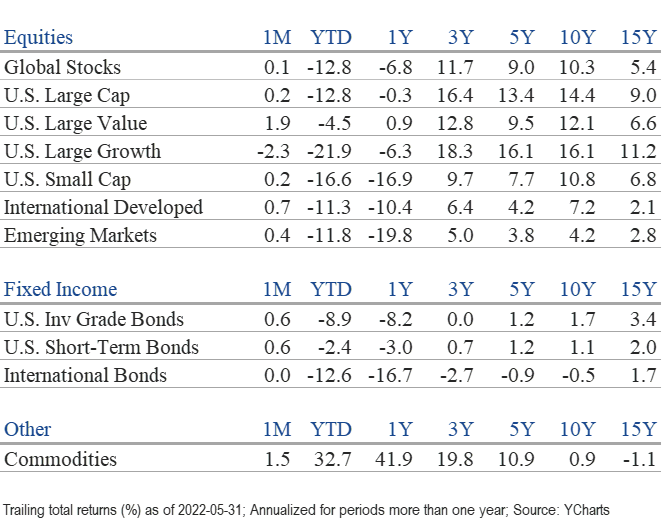
The information published herein is provided for informational purposes only, and does not constitute an offer, solicitation or recommendation to sell or an offer to buy securities, investment products or investment advisory services. All information, views, opinions and estimates are subject to change or correction without notice. Nothing contained herein constitutes financial, legal, tax, or other advice. The appropriateness of an investment or strategy will depend on an investor’s circumstances and objectives. These opinions may not fit to your financial status, risk and return preferences. Investment recommendations may change, and readers are urged to check with their investment advisors before making any investment decisions. Information provided is based on public information, by sources believed to be reliable but we cannot attest to its accuracy. Estimates of future performance are based on assumptions that may not be realized. Past performance is not necessarily indicative of future returns. The following indexes were used as proxies in the performance tables: Global Stocks = MSCI ACWI; U.S. Large Cap = S&P 500; U.S. Large Value = Russell 1000 Value; U.S. Large Growth = Russell 1000 Growth; U.S. Small Cap = Russell 2000; Int’l Dev Stocks = MSCI EAFE; Emerging Markets = MSCI EM; U.S. Inv Grade Bonds = Barclays U.S. Aggregate; U.S. High Yield Bonds = Barclays Corporate High Yield; Emerging Markets Debt = JPMorgan EMBI Global Diversified; Int’l Bonds = Barclays Global Treasury ex US; Cash = 3month T-Bill; Sector returns displayed in the chart represent S&P 500 sectors, while treasury benchmarks are from Barclays
Source: Schwab Center for Financial Research with data provided by Morningstar, Inc., as of 3/31/2022. Asset class performance represented by annual total returns for the following indexes: S&P 500® Index (US Lg Cap), Russell 2000® Index (US Sm Cap), MSCI EAFE® Net of Taxes (Int’l Dev), MSCI Emerging Markets IndexSM (EM), MSCI US REIT Index (REITs), S&P GSCI® (Comm.), Bloomberg Barclays U.S. Treasury Inflation-Linked Bond Index (TIPS), Bloomberg Barclays U.S. Aggregate Bond Index (Core US Bonds), Bloomberg Barclays U.S. High Yield Bond Index (High Yield Bonds), Bloomberg Barclays Global Aggregate Ex-USD TR Index (Int’l Dev Bonds), Bloomberg Barclays Emerging Markets USD Bond TR Index (EM Bonds), FTSE U.S. 3-Month T-Bill Index (T-Bills). Past results are not an indication or guarantee of future performance. Returns assume reinvestment of dividends, interest, and capital gains. Indexes are unmanaged, do not incur fees or expenses, and cannot be invested in directly.
Chart of the Month: A Wealth of Common Sense, Ritholtz Wealth Management LLC
Chart of the Month
Quote of the Month
“I’ve lived through some terrible things in my life, some of which have actually happened.”
Mark Twain
Trailing Returns