Market Perspectives May 2022
Capital Markets
By: Wade Austin
The magnitude of risk factors associated with inflation, war, and disease mounted in April leaving investors with few places to hide. Both stocks and bonds extended their 2022 declines as the dangerous confluence of rising rates, geopolitical uncertainty, and further supply chain disruptions from China’s Covid outbreak prompted an escalation of stagflation and recession fears.
Investor anxiety was manifested in heightened, broad-based capital markets volatility. 87% of 2022’s trading days have seen the S&P 500 swing at least 1%, the most (by far) since the 2008-2009 financial crisis.
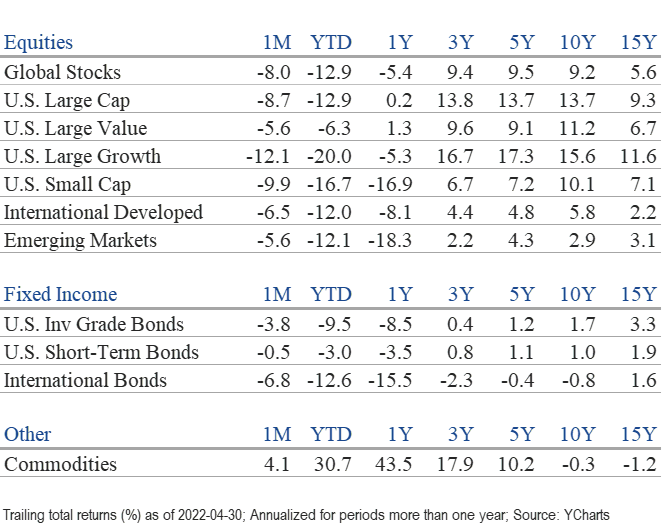
After rallying 4% in March, the S&P 500 index fell 8.7% in April, its worst month since March 2020. Of the index’s eleven major sectors, Consumer Staples was the sole gainer (+2.6%). Communications Services (-15.6%) was the laggard. International developed and emerging market stocks also tumbled but fared slightly better than the U.S. stocks, falling 6.5% and 5.6% respectively.
U.S. large-, mid-, and small-cap stocks each ended April in correction territory. Down 12.9% YTD, the S&P 500 rested just shy of the average 13.7% decline during the previous 27 corrections since WWII. Perhaps encouraging, the average recovery period was approximately four months.
With the Federal Reserve signaling a more aggressive tightening policy in terms of both rate hikes and balance sheet reduction, U.S. Treasury yields surged across the curve, triggering widespread declines for bonds. As the 10-year U.S. Treasury spiked in April from 2.34% to 2.94%, the U.S. aggregate bond index fell 3.8% by month-end and 9.5% YTD, its worst start to a year since 1980. Short duration bonds protected better against the stock selloff but still produced negative returns (-3.0% YTD).
Given such an exceptionally difficult period for bonds, it is important to note that much of the bad news and currently anticipated rate hikes are already priced in. The 2-year U.S. Treasury yielded 0.16% twelve months ago. Despite the Fed raising rates only 25 basis points since, the 2-year yield jumped to 2.69% by April 30th. Even if the Fed hikes more aggressively than anticipated, long-term rates may not push much higher, especially if the market continues to price in an overcorrection. Bonds have often proven to be resilient following selloffs and may create opportunities going forward given their higher yields.
With surging inflation, commodities continued to be the lone bright spot, rising 4.1% in April. Conversely, the valuations of growth stocks and speculative asset classes have been de-rated. As many of its constituent companies with high P/E ratios reported positive but slowing Q1 earnings growth, the Nasdaq Composite was more vulnerable to the resulting compression of P/E multiples. The technology-heavy NASDAQ declined 13.3% in April (its worst month since 2008) and 21.2% YTD. Some of its recent dependable leaders plunged in April including Netflix (-49%), Nvidia (-32%), Amazon (-24%), and Google (-18%).
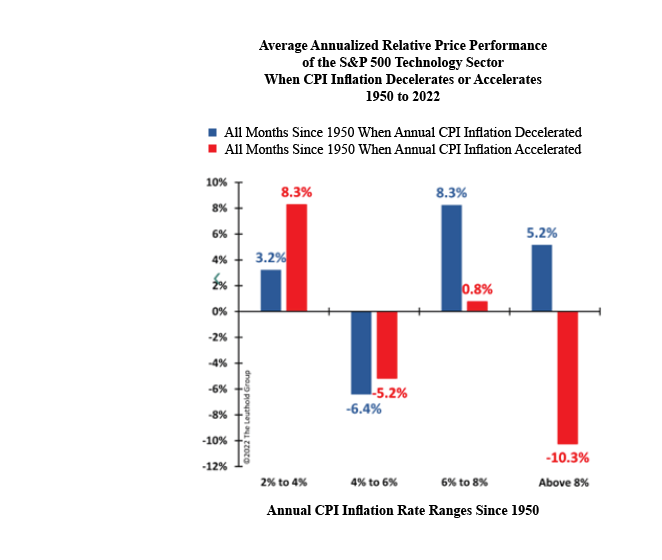
A turnaround for technology stocks might not occur until inflation moderates. Our Chart of the Month compared the relative performance of the S&P 500 Technology sector during periods of accelerating and decelerating inflation since 1950. James Paulsen, Chief Investment Strategist of The Leuthold Group, noted that when CPI inflation was greater than 8% (it is 8.5% today), accelerating inflation was detrimental to the Technology sector. However, Technology substantially outperformed the overall index when inflation moderated from elevated levels.
Investors, business owners and executives, economists, and consumers are all anxiously waiting for inflation to peak. When that occurs, technology and other high P/E stocks should rebound.
Insights by John Silvia, Director of Economics

Slower economic growth, persistent inflation, and a Federal Reserve focused on raising interest rates in the year ahead dominate the economic framework. Meanwhile, the Russia/Ukraine conflict remains the major external uncertainty.
- The economic growth outlook remains positive for 2022 but at a pace much slower than in 2021. Leading indicators, such as new capital goods orders, are below the level of the fourth quarter of 2021 and below a year ago. Jobless claims are above a month ago level. Consumer sentiment is below the level of three months ago.
- Yet, these indicators signal a slowdown but not a recession. The most recent jobs report indicated a gain of 400,000 jobs. The job gains were widespread in construction, manufacturing, professional services, and leisure & hospitality. The ISM manufacturing and services indices remain in expansion territory, and the leading indicators index is up 2% over the last six months.
- Persistent inflation remains a problem, but there is a glimmer of hope as the Fed’s benchmark inflation rate moved down. Core PCE inflation, the target of Fed policy, came in at 4.3% for the last three months, as of March, below the pace of 5.2% over a year ago. These numbers, however, are significantly above the Fed’s target of 2%, so there is more to go before declaring victory.
- From the ISM manufacturing survey, the prices paid index remains at an exceedingly elevated level (84.6) – a level above both Q1 2022 and Q4 2021 averages. The price pressures gauge released by the Federal Reserve Bank of St. Louis came in at an all-time high.
- While we may be seeing peak inflation numbers right now, sustained inflation above the Fed’s target compels investors to review their portfolios and revisit the inflation and interest rate assumptions that are implicit in their portfolios.
- Higher inflation will imply persistent increases in the federal funds rate and benchmark 2-year, 5-year, and 10-year interest rates. At this point, commentators have interpreted an inverted yield curve as a signal of a recession ahead. Yet, corporate bond spreads have not widened significantly, and leading indicators still signal economic growth over the next six months.
- For investors, the conflict between Russia and Ukraine continues to have pervasive impacts on economic growth (profits), inflation, interest rates, and the dollar exchange rates. Economic growth expectations have dropped, and inflation has reduced real disposable personal income and consumer confidence. Slower Euro-area growth is also in the cards.
- Finally, the U.S. dollar has risen in value as a haven for global investors. The dollar has also benefitted from the liquidity payments issue for the Russian ruble.
- Therefore, the outlook remains for modest economic growth in 2022 (certainly below the pace of 2021), persistent above Fed target inflation, and thereby Fed policy rate increases in both June and July.
Periods of accelerating and decelerating growth/inflation benchmarks can distract from the long-run goals of investors. Investment opportunities, and risks, change as the economic recovery evolves often due to changes in economic policy. Our view remains, as it has for months, that the economic outlook in 2022 and 2023 will not be a repeat of 2021 and will be more challenging for investors. Constant awareness of economic and political developments is necessary for thoughtful portfolio management.
Quote of the Month
“If you can keep your head when all about you are losing theirs and blaming it on you; yours is the earth and everything that’s in it.”
Rudyard Kipling
Chart of the Month
The information published herein is provided for informational purposes only, and does not constitute an offer, solicitation or recommendation to sell or an offer to buy securities, investment products or investment advisory services. All information, views, opinions and estimates are subject to change or correction without notice. Nothing contained herein constitutes financial, legal, tax, or other advice. The appropriateness of an investment or strategy will depend on an investor’s circumstances and objectives. These opinions may not fit to your financial status, risk and return preferences. Investment recommendations may change, and readers are urged to check with their investment advisors before making any investment decisions. Information provided is based on public information, by sources believed to be reliable but we cannot attest to its accuracy. Estimates of future performance are based on assumptions that may not be realized. Past performance is not necessarily indicative of future returns. The following indexes were used as proxies in the performance tables: Global Stocks = MSCI ACWI; U.S. Large Cap = S&P 500; U.S. Large Value = Russell 1000 Value; U.S. Large Growth = Russell 1000 Growth; U.S. Small Cap = Russell 2000; Int’l Dev Stocks = MSCI EAFE; Emerging Markets = MSCI EM; U.S. Inv Grade Bonds = Barclays U.S. Aggregate; U.S. High Yield Bonds = Barclays Corporate High Yield; Emerging Markets Debt = JPMorgan EMBI Global Diversified; Int’l Bonds = Barclays Global Treasury ex US; Cash = 3month T-Bill; Sector returns displayed in the chart represent S&P 500 sectors, while treasury benchmarks are from Barclays
Source: Schwab Center for Financial Research with data provided by Morningstar, Inc., as of 3/31/2022. Asset class performance represented by annual total returns for the following indexes: S&P 500® Index (US Lg Cap), Russell 2000® Index (US Sm Cap), MSCI EAFE® Net of Taxes (Int’l Dev), MSCI Emerging Markets IndexSM (EM), MSCI US REIT Index (REITs), S&P GSCI® (Comm.), Bloomberg Barclays U.S. Treasury Inflation-Linked Bond Index (TIPS), Bloomberg Barclays U.S. Aggregate Bond Index (Core US Bonds), Bloomberg Barclays U.S. High Yield Bond Index (High Yield Bonds), Bloomberg Barclays Global Aggregate Ex-USD TR Index (Int’l Dev Bonds), Bloomberg Barclays Emerging Markets USD Bond TR Index (EM Bonds), FTSE U.S. 3-Month T-Bill Index (T-Bills). Past results are not an indication or guarantee of future performance. Returns assume reinvestment of dividends, interest, and capital gains. Indexes are unmanaged, do not incur fees or expenses, and cannot be invested in directly.
Chart of the Month
Quote of the Month
“If you can keep your head when all about you are losing theirs and blaming it on you; yours is the earth and everything that’s in it.”
Rudyard Kipling
Trailing Returns