Market Perspectives July 2022
Capital Markets
By: Wade Austin
After flirting with bear market territory in mid-May, equity markets rebounded off their lows through early June on emerging signs that inflation had finally peaked by April. Those optimistic expectations were shattered on June 10th after the U.S. Bureau of Labor Statistics reported inflation accelerated in May. The headline CPI rose 1.0% m/m and 8.6% y/y, while core inflation was up 0.6% m/m.
The negative surprise felt like a watershed event to some investors. Markets urgently priced in the escalating likelihood of larger rate hikes, slower economic growth, and an impending recession. U.S. equity indexes posted their worst week since March 2020 and plunged into an official bear market before closing above their mid-June lows.
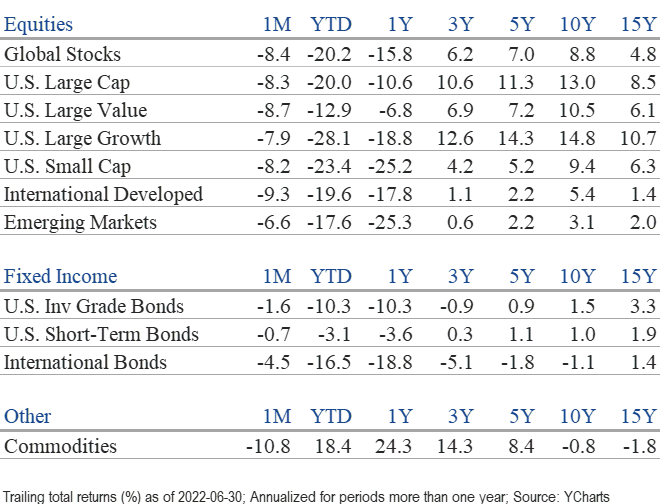
The S&P 500 concluded an extraordinarily difficult first half of 2022 by declining on a total return basis of 8.3% in June and 16.1% during Q2. With a YTD decline of 20.0%, the benchmark U.S. index suffered its worst first half since 1970. Small-cap stocks (-23.4%) and the technology-heavy NASDAQ (-29.2%) underperformed the S&P 500, while emerging markets (-17.6%) and international stocks (-19.6%) narrowly led U.S. stocks.
Value stocks suffered less damage than growth stocks in the first half (-12.9% vs -28.1%), but each equity style and size category incurred double-digit declines. All eleven major S&P 500 sectors fell in June, although traditional defensive sectors – healthcare and consumer staples – performed best. On a YTD basis, energy was the only sector to post gains (+31.6%), despite experiencing a dramatic reversal in June (-16.9%). Consumer discretionary (-32.8%) was the first-half’s worst-performing sector due to mounting concerns about the strength of the U.S. consumer.
The same headwinds pressuring equities have also punished bonds. In response to the higher-than-expected inflation report, the Federal Reserve hiked rates at its June meeting by 75 basis points (bps), the largest single increase since 1994. The yield on the 10-year U.S. Treasury note soared to 3.5% by mid-June before retreating to 3.02% at month’s end.
10-year yields have doubled from the start of 2022 (1.52%), while 2-year Treasury yields have risen 4x (0.73% to 2.96%). With dramatically higher yields across all traditional fixed income sectors, the U.S. aggregate bond index posted outsized total returns declines in June (-1.57%), Q2 (-4.69%), and the first-half (-10.4%).
Commodities were about the only asset class that worked during the first-half, although they were not immune to intense volatility. The broad-based commodity index climbed 18.4% YTD despite a 10.4% decline in June. The positive side of the recent pullback in commodity prices is that this month’s CPI print may finally reflect the peak in inflation.
The first-half of 2022 marked only the fourth time since 1976 that both stocks and bonds posted negative returns over two consecutive quarters. As a result, the 60/40 portfolio posted its worst first-half performance (-16.1%) in over 50 years. Given that major macro challenges remain unresolved entering the second-half, investor anxiety is certainly justified, if not too pessimistic. Despite an unemployment rate near all-time lows (3.6%), consumer sentiment has dropped below levels reached during the Great Financial Crisis when unemployment was 10%.
However, fear is an investor’s worst enemy during periods of extreme market stress. Bond and equity investors have already priced in the expected trajectory of interest rate hikes and perhaps even a mild recession. If economic conditions do not materially worsen and June’s 9.1% inflation report marks a peak, bonds and equities will likely pare their YTD losses. As a leading economic indicator, the S&P 500 has historically bottomed before conclusive evidence of an economic recovery materializes.
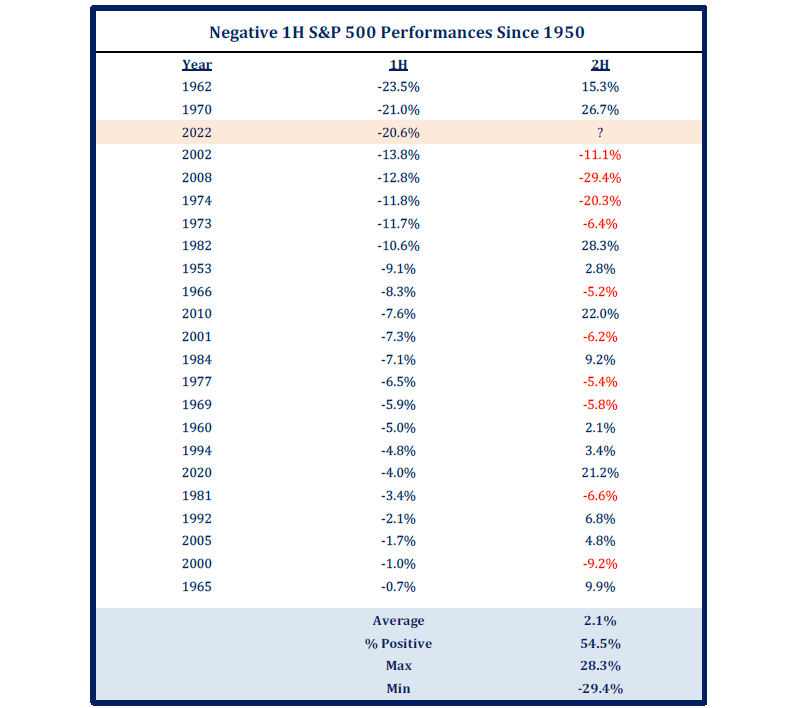
Our Chart of the Month reveals that the midpoint of the two years since 1950 (1962 and 1970) with worst first-half returns than 2022 were excellent buying opportunities. Nevertheless, the wide dispersion of second-half performance following the entire list of years with negative first-half returns suggests a more neutral near-term positioning.
Investors are anxiously awaiting the Q2 corporate earnings reporting season kicking off this week for confirmation that profits are still growing. Due to growth concerns, the S&P 500’s forward P/E ratio has already fallen this year from 21.0x to 15.9x, below its historical average. We anticipate continued, heightened volatility this summer as Q2 corporate results reveal the winners and losers during this challenging macro environment.
Insights by John Silvia, Director of Economics

In late June, Chairman Powell of the Federal Reserve raised the issue that the Fed must accept a higher risk of recession to combat inflation. For investors, this view reflects the uncertainty about how much restraint, in terms of interest rate increases, will be enough to reduce inflation and what is the subsequent impact on economic growth and employment.
- The answer is uncertain, but the Chairman’s phrasing suggests that further increases in interest rates are likely and that further downside to growth and employment are also to be expected. Slower economic growth, and thereby profits, combined with higher interest rates, implies a further period of volatility in the markets as investors search for value.
- Inflation brings with it another challenge to investors. Recent data make the case that the economy is not headed back to a 2% pace of inflation. An upward movement in inflation expectations and the persistence of inflation gains in recent months support the view that, as investors, we need to rethink the long-run path of inflation and how that path would influence the returns on cash, bonds, and equities.
- Three structural changes in the economy raise the risk profile for the inflation outlook. First, there is a deglobalization of trade and this means a shift in production to the home markets but also, in the short run, a higher cost of goods sold. Second, the shortage of labor persists and, in part, reflects the decline in labor force participation of older workers. For a given pace of demand, fewer workers would tend to lead to upwards pressure on prices. Finally, there is a geopolitical fragmentation that breaks down the breadth of lowering trade tariffs and thereby puts a higher floor on the inflation rates of traded goods. This has been particularly true in Europe with its struggle to source energy for continued industrial production.
- In recent months, we have witnessed increased concerns with the federal budget outlook. Slower growth forecasts by the Congressional Budget Office and the higher benchmark rates put in place by the Federal Reserve will place a greater burden on the debt through higher interest rates. Also, in recent years, an increasing share of the federal debt has become owned by the Federal Reserve.
- Debt fundamentals have deteriorated (slower economic growth per taxpayer dollar) which along with higher interest rates suggest that the debt burden will evolve into a scenario of higher taxes and spending cuts. Even more likely, the Fed will acquiesce and buy more debt providing an upward bias on the trajectory of inflation. For investors, this is another example of the need for a re-evaluation of the longer-term financial market values.
- Our outlook is that the Fed’s pursuit of inflation stability will bias interest rates upward and slow economic growth. Meanwhile, the Fed, the Bank of Canada, and the Bank of England will continue to raise benchmark policy rates at least another 100 basis points, implying further increases in the U.S. Treasury benchmark 2-year, 5-year, and 10-year interest rates.
- The conflict between Russia and Ukraine continues to have pervasive impacts on the outlook for Euro growth. The behavior of commodity prices has changed in recent weeks. Metals, such as copper, have seen significant price declines hinting that the weakness of the U.S. economy is dampening the enthusiasm for metal commodities.
- While economic growth has slowed in the U.S., the dollar continues to strengthen as global investors see a flight to safety channel for their investments.
- Our outlook remains for modest growth with the acknowledged risk of recession given the Fed’s aggressive pursuit of slower inflation. Interest rates are likely to rise with Fed actions.
- Meanwhile, slower economic growth and higher interest rates translate into lower profit growth in 2022 relative to 2021 and thereby a tougher investment horizon for equities and corporate debt.
For the past eight months, the evolution of the economic data has supported the economy – especially higher inflation, higher interest rates, and the uncertainty of the evolution of the burden of the federal debt. The Fed’s recent emphasis to bring the fight to inflation has raised the risk premium of higher interest rates and slower economic growth for investors.
Quote of the Month
“A down market lets you buy more shares in great companies at favorable prices. If you know what you’re doing, you’ll make most of your money from these periods. You just won’t realize it until much later.”
Shelby Davis, American Philanthropist and Money Manager
Chart of the Month
The information published herein is provided for informational purposes only, and does not constitute an offer, solicitation or recommendation to sell or an offer to buy securities, investment products or investment advisory services. All information, views, opinions and estimates are subject to change or correction without notice. Nothing contained herein constitutes financial, legal, tax, or other advice. The appropriateness of an investment or strategy will depend on an investor’s circumstances and objectives. These opinions may not fit to your financial status, risk and return preferences. Investment recommendations may change, and readers are urged to check with their investment advisors before making any investment decisions. Information provided is based on public information, by sources believed to be reliable but we cannot attest to its accuracy. Estimates of future performance are based on assumptions that may not be realized. Past performance is not necessarily indicative of future returns. The following indexes were used as proxies in the performance tables: Global Stocks = MSCI ACWI; U.S. Large Cap = S&P 500; U.S. Large Value = Russell 1000 Value; U.S. Large Growth = Russell 1000 Growth; U.S. Small Cap = Russell 2000; Int’l Dev Stocks = MSCI EAFE; Emerging Markets = MSCI EM; U.S. Inv Grade Bonds = Barclays U.S. Aggregate; U.S. High Yield Bonds = Barclays Corporate High Yield; Emerging Markets Debt = JPMorgan EMBI Global Diversified; Int’l Bonds = Barclays Global Treasury ex US; Cash = 3month T-Bill; Sector returns displayed in the chart represent S&P 500 sectors, while treasury benchmarks are from Barclays
Source: Schwab Center for Financial Research with data provided by Morningstar, Inc., as of 3/31/2022. Asset class performance represented by annual total returns for the following indexes: S&P 500® Index (US Lg Cap), Russell 2000® Index (US Sm Cap), MSCI EAFE® Net of Taxes (Int’l Dev), MSCI Emerging Markets IndexSM (EM), MSCI US REIT Index (REITs), S&P GSCI® (Comm.), Bloomberg Barclays U.S. Treasury Inflation-Linked Bond Index (TIPS), Bloomberg Barclays U.S. Aggregate Bond Index (Core US Bonds), Bloomberg Barclays U.S. High Yield Bond Index (High Yield Bonds), Bloomberg Barclays Global Aggregate Ex-USD TR Index (Int’l Dev Bonds), Bloomberg Barclays Emerging Markets USD Bond TR Index (EM Bonds), FTSE U.S. 3-Month T-Bill Index (T-Bills). Past results are not an indication or guarantee of future performance. Returns assume reinvestment of dividends, interest, and capital gains. Indexes are unmanaged, do not incur fees or expenses, and cannot be invested in directly.
Chart of the Month: Strategas
Chart of the Month
Quote of the Month
“A down market lets you buy more shares in great companies at favorable prices. If you know what you’re doing, you’ll make most of your money from these periods. You just won’t realize it until much later.”
Shelby Davis, American Philanthropist and Money Manager
Trailing Returns