Market Perspectives February 2024
Capital Markets
By: Wade Austin
January painted a mixed picture for capital markets, with some asset classes experiencing gains while others saw losses. Global equities edged higher, but fixed income retreated. Geopolitical tensions remained a concern, yet continued utilization of productive new AI workflows, positive economic data in the U.S., and expectations of Fed rate cuts fueled some optimism.
All three major U.S. equity indices edged higher, marking their third consecutive month of gains. The S&P 500 advanced 1.7%, the Dow Jones rose 1.3%, and the NASDAQ added 1.0%. In rebounding off its late-October low, the S&P 500’s three-month return of 16.0% ranked in the 99th percentile of all trailing three-month periods. The S&P 500 sector results were mixed, as five of the 11 posted a monthly gain during the first month of 2024. Communication services, up 5.0%, and technology, up 4.0%, were the leaders. After surging during the prior two months, real estate was the laggard, down 4.7%, followed by materials, down 3.9%.
Most notably, the S&P 500 achieved several all-time highs last month, ending a stretch of 745 days since its previous record high of 4,797 set on Jan. 3, 2022. The index stood at 4,846 at the end of the month, just below its all-time closing high of 4,928 set on Jan. 29. Despite rising 30.9% over the past 12-month period, the NASDAQ Composite Index remained 2.9% below its last all-time high of 16,057 set on Nov. 19, 2021.
Just as in 2022 and most of 2023, small-cap stocks struggled in January as rates rose. After rallying in late 2023, the Russell 2000 small-cap benchmark index reversed course, dropping 3.9%. Small-caps have substantially trailed large-caps since their last all-time high on Nov. 8, 2021. They remain 20% below that record high and have lagged the S&P 500 by 23 percentage points since then.
Turning to foreign markets, developed international stocks eked out a fractional gain. Japan was a top performer on the world stage in 2023, and the positive momentum carried over into the new year. It led the world, up 4.6%. Conversely, emerging market stocks suffered a 4.6% decline in January, largely thanks to China’s challenges. China’s stock market performance, which sold off 10.6% last month, has an outsized impact on the MSCI EM Index due to its 24% weight. Although Chinese stocks are cheap on a relative basis, they have been a classic “value trap” for decades. Amazingly, the MSCI China Index has been dead money—virtually flat—since 1993. Emerging markets are one of several asset classes where select active fund managers have consistently and dramatically outperformed the passive index-based ETFs.
U.S. Treasury yields were quite volatile in January, but the 10-year T-note concluded the month at 3.91%, only 3 bps higher than it had started. Last December, the bond market priced in expectations that the Fed would cut rates five times in 2024 beginning in March. However, rates began to rise as stronger-than-expected economic data was released throughout January. As a result, the U.S. Bloomberg Aggregate Bond Index declined 0.27%, and all fixed income sectors dropped fractionally.
After last week’s Federal Reserve meeting, Chairman Jerome Powell made clear that March would likely be too soon to cut. A blockbuster jobs report two days later only reinforced their inclination to stay at current levels until at least May. John Silvia, CIC’s Dir. of Economics, correctly predicted the Fed could not justify cutting rates in March and is “taking the under” on five cuts in 2024. Looking ahead, the Fed’s monetary policy decisions and inflation data will continue to be key market drivers.
Halfway through the Q4 corporate reporting season, S&P 500 earnings are expected to grow 7.8%, higher than Wall Street analysts’ 4.7% prior forecast on Jan. 1. Technology, communications services, and consumer discretionary sectors have delivered the most robust beats. The technology sector has also reported the strongest revenue growth. The key takeaway from this earnings season is that the “Sensational 6” collectively (the “Magnificent 7,” excluding Tesla) are the growth engine powering the U.S. economy. They accounted for all the earnings growth in 2023, as the earnings of the other 494 companies in the S&P 500 declined in aggregate. The earnings reports of the Sensational 6 made clear that AI is real and is expanding growth expectations.
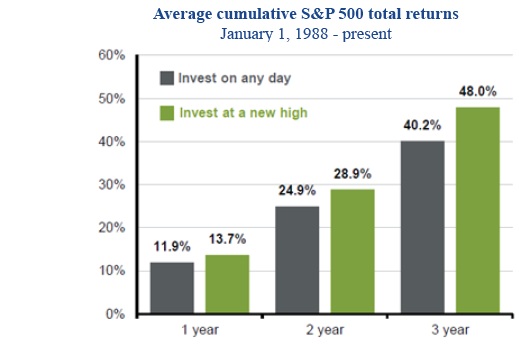
With the S&P 500 reaching a major milestone level at 5000, a pessimist may be inclined to head to the sidelines. However, the data suggests that a more optimistic tone is warranted. Our Chart of the Month indicates that over the past 35 years, the 1 -, 2-, and 3-year forward returns have been more favorable when investing at all-time highs than any random day. During this period, the 1-year forward return when investing at all-time highs was positive 85% of the time. Furthermore, only two of 11 S&P 500 sectors (technology and industrials) reached their all-time highs by Jan. 31. Better days are likely still ahead for the other nine sectors, leaving plenty of room for talented fund managers to outperform the index as we advance.
Insights by John Silvia, Director of Economics

Is the economy just too good? How quickly fortunes change! We began this year with expectations of moderate growth, slower inflation, and an easing in Fed interest rate levels. Analysts elsewhere had postulated six rate cuts.
Recent economic growth numbers signal an acceleration in growth above the pace that the Fed would consider trend. The latest inflation numbers have stalled at a pace of inflation above the Fed’s target. Finally, expectations for Fed easing in the year’s first half have sharply declined.
- First, what about growth? Economic indicators signal solid economic growth supported by job numbers and capital goods orders. For January, employment gains were reported at 353,000, with a rise in average hourly earnings of 4.5% year-over-year. In addition, consumer sentiment improved. These factors support solid consumer spending in the current quarter.
- Nondefense capital goods orders excluding aircraft in December were above the levels at the start of Q4. Business investment improved in structures, equipment, and intellectual property as well.
- Regarding inflation, the gain in average hourly earnings of 4.5% concerns the Fed. The Fed uses this indicator as a benchmark for inflation. Therefore, this suggests caution on the extent of Fed easing that is already priced into financial assets. Is the economy too good and the labor market too strong to allow an easing of monetary policy currently? Yes.
- Market expectations of a Fed easing in March have declined sharply to below 50%. Expectations for easing in May and June have also declined.
- Inflation has moderated but remains sticky, and core measures of inflation remain above the Fed’s target. Measures of inflation, such as the Federal Reserve Bank of Cleveland trimmed-mean (calculated by cutting over-the-top increases and decreases each month), have not moved lower in recent months. Above-trend economic growth and sticky inflation above target are not recipes for the Fed to lower interest rates.
- The FOMC continues to signal their data dependence. Current data would not alter Federal Reserve Chairman Powell’s recitation that “policy will remain at a restrictive stance for some time until inflation was moving down sustainably toward the Committee’s objective.” “Sustainably toward” is tough to define, but the current pace of wage/PCE numbers does not suggest that the Fed is attaining its goal right now.
- Finally, the imbalance between projected federal debt finance and potential economic growth remains, as clients have pointed out at our meetings. This imbalance has pushed up real rates over the last nine months despite declining nominal rates/inflation. This remains a hurdle to asset valuations.
- For investors, one notable improvement recently has been the gain in pre- and post-tax corporate profits in both Q3 and Q4. This development reflects the continued gains in final demand and improved productivity that has lowered unit labor costs. In Q4 2023, productivity improved by 2.7%, above the gains of the previous two quarters.
- Regarding the U.S. dollar, gains in economic growth expectations and no immediate Fed rate cuts have supported the appreciation of the dollar so far this year.
- Persistent, above-target inflation and limited easing in Fed policy will require investors to reassess their financial market valuations. Meanwhile, better economic growth will increase final sales and corporate profits.
- In retrospect, we retain our focus on the three-to-five-year investment horizon, given our expectation that the difficult period of 2022/early 2023 would eventually give way to better economic and financial times.
- China’s reopening continues to be disappointing in terms of the pace of growth. Moreover, there have been recent incidents of financial and commercial real estate weakness underlying China’s economic outlook. Caution is the watchword here. Finally, political tensions remain a consideration for international investors.
Quote of the Month
“More people lost money waiting for corrections and anticipating corrections than the actual corrections.”
Peter Lynch – American Investor, Mutual Fund Manager, and Author
Chart of the Month
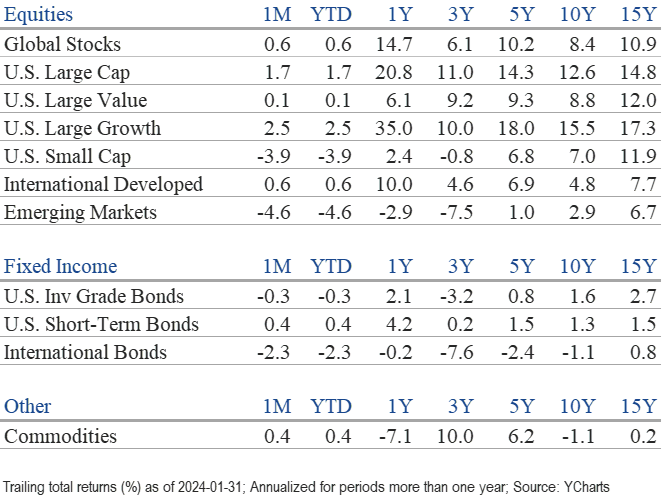
The information published herein is provided for informational purposes only, and does not constitute an offer, solicitation or recommendation to sell or an offer to buy securities, investment products or investment advisory services. All information, views, opinions and estimates are subject to change or correction without notice. Nothing contained herein constitutes financial, legal, tax, or other advice. The appropriateness of an investment or strategy will depend on an investor’s circumstances and objectives. These opinions may not fit to your financial status, risk and return preferences. Investment recommendations may change, and readers are urged to check with their investment advisors before making any investment decisions. Information provided is based on public information, by sources believed to be reliable but we cannot attest to its accuracy. Estimates of future performance are based on assumptions that may not be realized. Past performance is not necessarily indicative of future returns. The following indexes were used as proxies in the performance tables: Global Stocks = MSCI ACWI; U.S. Large Cap = S&P 500; U.S. Large Value = Russell 1000 Value; U.S. Large Growth = Russell 1000 Growth; U.S. Small Cap = Russell 2000; Int’l Dev Stocks = MSCI EAFE; Emerging Markets = MSCI EM; U.S. Inv Grade Bonds = Barclays U.S. Aggregate; U.S. High Yield Bonds = Barclays Corporate High Yield; Emerging Markets Debt = JPMorgan EMBI Global Diversified; Int’l Bonds = Barclays Global Treasury ex US; Cash = 3month T-Bill; Sector returns displayed in the chart represent S&P 500 sectors, while treasury benchmarks are from Barclays
Source: Schwab Center for Financial Research with data provided by Morningstar, Inc., as of 3/31/2022. Asset class performance represented by annual total returns for the following indexes: S&P 500® Index (US Lg Cap), Russell 2000® Index (US Sm Cap), MSCI EAFE® Net of Taxes (Int’l Dev), MSCI Emerging Markets IndexSM (EM), MSCI US REIT Index (REITs), S&P GSCI® (Comm.), Bloomberg Barclays U.S. Treasury Inflation-Linked Bond Index (TIPS), Bloomberg Barclays U.S. Aggregate Bond Index (Core US Bonds), Bloomberg Barclays U.S. High Yield Bond Index (High Yield Bonds), Bloomberg Barclays Global Aggregate Ex-USD TR Index (Int’l Dev Bonds), Bloomberg Barclays Emerging Markets USD Bond TR Index (EM Bonds), FTSE U.S. 3-Month T-Bill Index (T-Bills). Past results are not an indication or guarantee of future performance. Returns assume reinvestment of dividends, interest, and capital gains. Indexes are unmanaged, do not incur fees or expenses, and cannot be invested in directly.
Chart of the Month: J.P. Morgan
Chart of the Month
Quote of the Month
“More people lost money waiting for corrections and anticipating corrections than the actual corrections.”
Peter Lynch – American Investor, Mutual Fund Manager, and Author
Trailing Returns