Market Perspectives March 2024
Capital Markets
By: Wade Austin
February 2024 proved to be a month of surprising strength for equities and a continuation of unease in the bond market. Here’s a breakdown of the major themes:
Equity Markets:
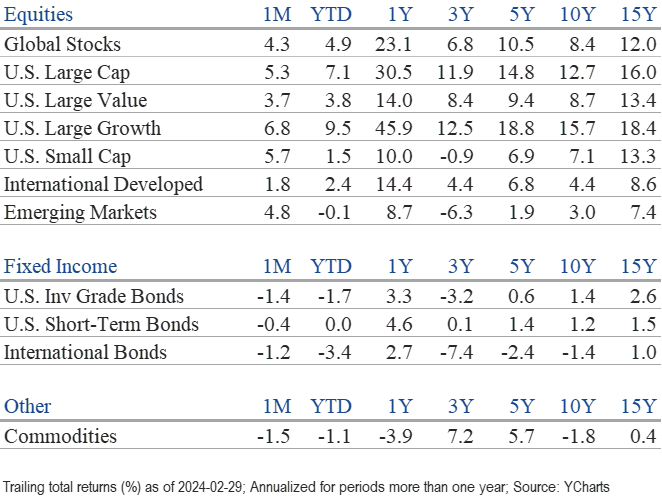
- U.S. stocks surged to new highs, with the S&P 500 gaining an impressive 5.3% and reaching an all-time high of 5,096 at the end of February. This positive momentum extended to global equities, with the MSCI World Index rising 4.3%.
- On Feb. 29, the Nasdaq Composite became the third major index to join the new all-time high milestone, last reached on Nov. 19, 2021. While the Nasdaq is up 7% YTD, last year’s darlings, the “Magnificent 7,” have experienced mixed results in 2024. After Tesla’s decline in January, the market leaders were rebranded as the “Sensational 6”. With Apple and Alphabet’s stumbles in February, another name change is in order – “the Fab 4.” Nvidia, Meta, Amazon, and Microsoft are up anywhere from 10% to 60%.
- Large-cap stocks continued beating small-caps on a YTD basis, although small-caps’ 5.7% return outperformed in February. While the Dow, S&P 500, and Nasdaq Composite traded at all-time highs in February, the Russell 2000 small-cap index remained 16% below its last high on Nov. 8, 2021.
- All 11 major sectors comprising the S&P 500 made gains last month. Consumer discretionary (+8.7%) led, while utilities (+1.1%) was the laggard. Growth stocks, led by Nvidia’s powerful surge upon posting record earnings and revenue on Feb. 21, have maintained last year’s momentum and outperformed value stocks in 2024 (9.5% vs. 3.8%).
Bond Markets:
- U.S. bonds declined for the second straight month as January’s hotter-than-expected CPI report forced investors to temper their expectations for rate cuts this year. The 10-year U.S. Treasury yield jumped from 3.91% to 4.25%. While significantly below its recent high of 4.99% last October, the benchmark Treasury yield remains well above its trailing 10-year average of 2.33%.
- The Bloomberg U.S. Aggregate Bond Index dropped 1.4% in February, as most fixed income sectors declined. Only high yield and municipal bonds advanced, gaining 0.3% and 0.1% respectively.
- On the heels of a stellar Q4 rally, the yield on the 10-year T-note backed up 37 bps YTD, resulting in a modest 2.6% decline for the “agg”. In this environment of rising yields and resilient economic growth, it’s not surprising that high yield bonds (+0.29%) have been the sole winner.
Key Takeaways:
- February marked four consecutive months of gains, a 99th-percentile occurrence. Investor confidence in corporate earnings and economic growth, topped off with a “fear of missing out” (FOMO) sentiment, have been catalysts.
- After such a winning streak, caution is warranted in the short term as valuations have become stretched. Furthermore, the first several weeks of March have been a seasonally sluggish period for stocks, especially during presidential election years.
- However, the S&P 500’s uptrend from November to February is a bullish indicator for the remainder of the year. The calendar year was never lower on the 14 previous such occasions, and the next 10 months’ returns averaged +14.9%.
- Concerns about inflation persist, keeping a lid on potential bond market rallies. February’s CPI print, to be released on Tuesday, will be closely monitored. Expectations are for moderation after January’s surprisingly hot report, but a surprise in either direction would likely be a market-moving event.
- The Fed’s monetary policy will remain a crucial determinant of future market direction.
Reflections:
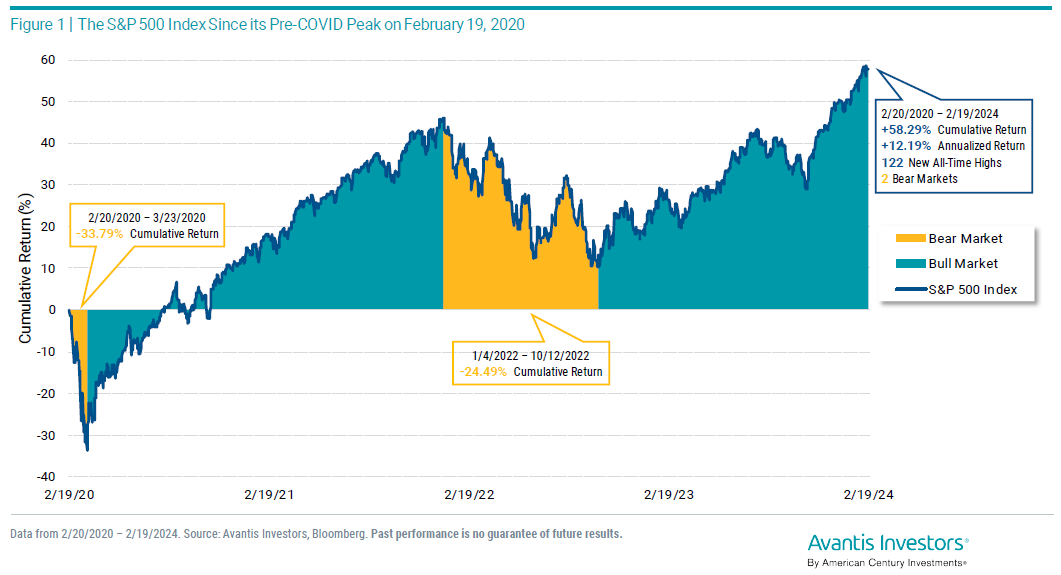
- February 19 marked four years since the pre-Covid market peak. The S&P 500 initially sank 34%, a record decline over just four weeks. On March 16, the S&P 500 plunged nearly 12%, the second largest single-day decline on record! After bottoming on March 23, the index took off before entering a second bear market in 2022.
- Despite two painful bear markets within just four years, our Chart of the Month from Avantis Investors reveals that the cumulative return for the entire four-year period was 58.3%, with 122 all-time highs along the way. Amazingly, its annualized return of 12.2% beat the index’s long-term average.
- Given that both painful periods are still fresh in our minds, these robust 4-year results are an impactful reminder that while declines are a normal part of investing in stocks, a balanced, long-term view has always worked out for investors.
- Since 1926, the S&P 500 has experienced a correction (10% decline or worse) every three years on average and a bear market (20% decline or worse) every six years. The S&P 500 reached a new all-time high in January, fully recovering from the latest downturn, just as it always has.
- Our experience is that helping investors implement a carefully constructed risk management plan enables them to focus on the big picture and successfully navigate the inevitable good and bad times along the way.
Insights by John Silvia, Director of Economics

Equity market indices are up on the year. What are the economic fundamentals that support such a move? Three factors drive the economic fundamentals: the outlook for economic growth, inflation expectations, and the view of interest rates and Fed policy moves.
The year began with expectations of moderate growth for the economy. However, analysts also expected a recession or limited growth. What changed the outlook for “moderate but low growth” to a more optimistic “trend-plus” rate of growth?
- First, the labor market was strong. Initial jobless claims, a leading indicator, remained low and did not signal a rise in layoffs consistent with a recession/slow growth period.
- Second, job gains were robust. Private payrolls rose an average of 265,000 over the last three months (ending February), compared to 229,000 during the previous 12 months. Meanwhile, average hourly earnings rose 4.0% over the last three months, compared to a gain of 4.3% over the last year. This combination of job and wage gains led to real income gains for households and, thereby, stronger consumer demand.
- Consumer sentiment in February was above the levels of December for both the current assessment of the economy and expectations for the future.
- For business, nondefense capital goods orders excluding aircraft in January were above the levels at the start of Q4. Business investment improved for structures, equipment, and intellectual property in Q4 as well.
- The latest economic growth numbers signal an acceleration in growth above the pace the Fed would consider trend. For the Fed, the pace of growth signals the risk of higher inflation ahead.
- Yet, the inflation numbers continue to moderate. The Fed’s benchmark inflation measure, core PCE, has slowed year over year. Over the last three months, this measure of core inflation has slowed to 2.6% from a pace of 2.8% over the previous 12 months.
- Slower inflation removes the expectation for the Fed to raise rates; this has been a plus for both the equity and bond markets. However, expectations for any Fed easing in the first half of the year have sharply declined since the current inflation pace of 2.6% remains far above the Fed’s 2% target.
- Also, the gain in average hourly earnings of 4.3% over a year ago concerns the Fed. The Fed uses this indicator as a benchmark for gauging future inflation prospects. Therefore, this suggests caution on the extent of Fed easing ahead, already priced into financial assets. Is the economy too good and the labor market too strong to allow an easing of monetary policy currently? Yes. June looks like a more likely prospect for the Fed to ease.
- For a leading indicator of inflation, we track the Federal Reserve Bank of Cleveland’s trimmed-mean (calculated by excluding the top increases and decreases each month). This series has not moved down in recent months. Above-trend economic growth and sticky inflation are not a recipe for the Fed to lower interest rates.
- We expect that the Fed will not lower the funds rate until the June meeting at the earliest.
- For investors, one notable recent improvement was the gain in both pre- and post-tax corporate profits in Q3 and Q4. This development reflects the combination of continued gains in final demand with improved productivity, which has lowered unit labor costs.
- To follow up on our earlier commentaries, the forecast for sustained, higher long-run Treasury market interest rates compared to the decade of 2012-2019 has indeed come true.
- While forecasts of a recession have drifted away, U.S. financial markets continue to adjust to the economic reality of better-than-expected economic growth, higher-for-longer interest rates, and recently improved profit expectations. These factors support a more positive but cautious view of financial asset valuations relative to the challenges of 2022 and Q1 2023.
- On the global front, China’s reopening continues to be disappointing in terms of the pace of growth. Moreover, recent incidents of financial and commercial real estate weakness have corroded the economic outlook for China. Caution is the watchword here as well. Finally, political tensions between the U.S. and China remain a consideration for international investors.
Quote of the Month
“The essence of investment management is the management of risks, not the management of returns.”
Benjamin Graham – British-born, American Financial Analyst, Investor, and Professor
Chart of the Month
The information published herein is provided for informational purposes only, and does not constitute an offer, solicitation or recommendation to sell or an offer to buy securities, investment products or investment advisory services. All information, views, opinions and estimates are subject to change or correction without notice. Nothing contained herein constitutes financial, legal, tax, or other advice. The appropriateness of an investment or strategy will depend on an investor’s circumstances and objectives. These opinions may not fit to your financial status, risk and return preferences. Investment recommendations may change, and readers are urged to check with their investment advisors before making any investment decisions. Information provided is based on public information, by sources believed to be reliable but we cannot attest to its accuracy. Estimates of future performance are based on assumptions that may not be realized. Past performance is not necessarily indicative of future returns. The following indexes were used as proxies in the performance tables: Global Stocks = MSCI ACWI; U.S. Large Cap = S&P 500; U.S. Large Value = Russell 1000 Value; U.S. Large Growth = Russell 1000 Growth; U.S. Small Cap = Russell 2000; Int’l Dev Stocks = MSCI EAFE; Emerging Markets = MSCI EM; U.S. Inv Grade Bonds = Barclays U.S. Aggregate; U.S. High Yield Bonds = Barclays Corporate High Yield; Emerging Markets Debt = JPMorgan EMBI Global Diversified; Int’l Bonds = Barclays Global Treasury ex US; Cash = 3month T-Bill; Sector returns displayed in the chart represent S&P 500 sectors, while treasury benchmarks are from Barclays
Source: Schwab Center for Financial Research with data provided by Morningstar, Inc., as of 3/31/2022. Asset class performance represented by annual total returns for the following indexes: S&P 500® Index (US Lg Cap), Russell 2000® Index (US Sm Cap), MSCI EAFE® Net of Taxes (Int’l Dev), MSCI Emerging Markets IndexSM (EM), MSCI US REIT Index (REITs), S&P GSCI® (Comm.), Bloomberg Barclays U.S. Treasury Inflation-Linked Bond Index (TIPS), Bloomberg Barclays U.S. Aggregate Bond Index (Core US Bonds), Bloomberg Barclays U.S. High Yield Bond Index (High Yield Bonds), Bloomberg Barclays Global Aggregate Ex-USD TR Index (Int’l Dev Bonds), Bloomberg Barclays Emerging Markets USD Bond TR Index (EM Bonds), FTSE U.S. 3-Month T-Bill Index (T-Bills). Past results are not an indication or guarantee of future performance. Returns assume reinvestment of dividends, interest, and capital gains. Indexes are unmanaged, do not incur fees or expenses, and cannot be invested in directly.
Chart of the Month: Avantis Investors
Chart of the Month
Quote of the Month
“The essence of investment management is the management of risks, not the management of returns.”
Benjamin Graham – British-born, American Financial Analyst, Investor, and Professor
Trailing Returns