Market Perspectives January 2024
Capital Markets
By: Wade Austin
December was a month of festive cheer for capital markets, with investors enjoying the strong finish to the year. The combination of easing inflation, dovish central bank signals, and resilient economic data provided a strong tailwind for most asset classes.
Reflecting on 2023, the optimism ending the year stood in stark contrast to the dour mood at the beginning. Pessimism and high anxiety abounded as the Federal Reserve was still raising rates, inflation was high, and consensus economic forecasts expected a recession (tip of the hat to our Dir. of Economics, John Silvia, who rejected the recession call for 2023). If one had the foresight to anticipate spring’s regional banking crisis, which led to three of the country’s four largest banking failures ever and a Middle Eastern war that broke out in the fall, many more investors would have understandably embraced the movement to cash that became known as “T-Bill and Chill.”
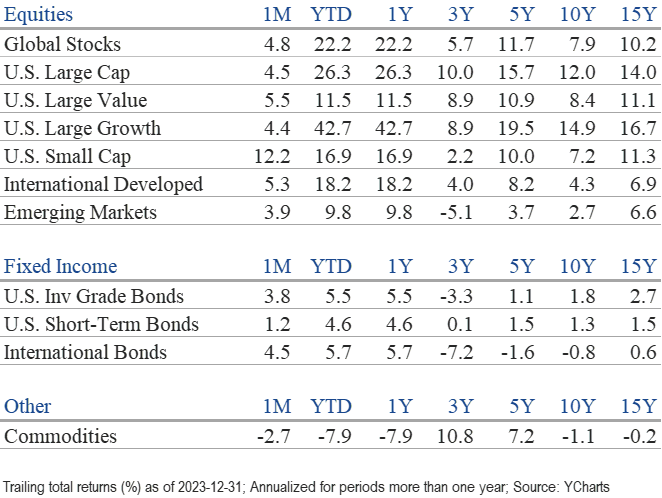
While cash can be comforting, opportunity cost is a threat. As markets rebounded during 2023 in a mirror image to the declines in 2022, cash—despite its decade-high return of 5.1%—lagged every other asset class except commodities (-7.9%). Commodities struggled in 2023 due, in large part, to China’s growth problems. Consistent with the year-over-year reversal theme, commodities were the only asset class that managed gains in 2022.
After the market backdrop suddenly flipped to upbeat in late October, U.S. and global stocks took off in November and December, generating stellar Q4 and full-year returns. The S&P 500 closed the year on a nine-week winning streak by posting a quarterly total return of 11.7% and 26.2% for the year. Outside the U.S., international developed stocks rallied to a robust 18.9% return last year, outperforming emerging markets’ 10.5% gain. On a sector basis, technology led the way (+57.8%), followed by communications services (+55.8%) and consumer discretionary (+42.4%). Energy was Q4’s sole decliner and joined utilities struggling during the year (-1.3% and -7.1%, respectively).
The biggest story in stocks during 2023 was the emergence of generative AI, the potentially transformative new technology that fueled explosive returns among a handful of mega-cap technology companies dubbed the “Magnificent Seven” (Mag 7). By the end of October, the top 10 largest weights in the S&P 500 (the Magnificent Seven plus Berkshire Hathaway, UnitedHealth Group, and J.P. Morgan) contributed 124% of the index’s YTD return, while the other 490 stocks were negative. However, after the 10-year Treasury yield peaked at 5% on Oct. 23, the rest of the market has since significantly outperformed the Mag 7. At year-end, the 10 largest weights’ contribution had declined to 68% of the index, its second-highest level in 30 years.
In addition to being the early beneficiaries of GenAI, the Mag 7’s fortress balance sheets were attractive to investors in the high-rate environment. As rates plunged (10-year Treasury yields dropped from 5% to 3.79% by Dec. 27), companies more sensitive to interest rates became more attractive. During this final two-month period, the equal-weight S&P 500 Index beat the cap-weighted S&P 500 by 4.8%, while small-cap stocks outperformed the S&P 500 by a whopping 8.6%.
With the abrupt decline in yields, the price of bonds rebounded sharply, generating a two-month gain greater than a money market fund’s annual return. The Bloomberg U.S. Aggregate Bond Index exited September with a negative YTD return but rallied 6.8% during Q4 to post a solid 5.5% full-year return. U.S. IG bonds (+8.5%) and Municipals (6.4%) outperformed the index. High-yield bonds were the top-performer (+13.4%) due to their low default rate amid the surprising resilience of the U.S. economy and corporate financials.
Entering 2024, we will be closely watching for signs of continued economic growth, the timing of potential rate cuts, and the impact of geopolitical tensions. While the current sentiment is positive, 2023 will be a tough act to follow for equities. Week 1 was an inauspicious beginning, as it appears investors waited for the new tax year before profit-taking from last year’s biggest winners. The Mag 7 stocks are richly valued now and may need time to digest their enormous gains. However, GenAI promises to be as impactful, if not more than, the advent of the PC and the internet and will be a massive opportunity for many years. Although these stocks skew the major index’s topline P/E ratios, the valuations of many other quality companies rest at more modest levels.
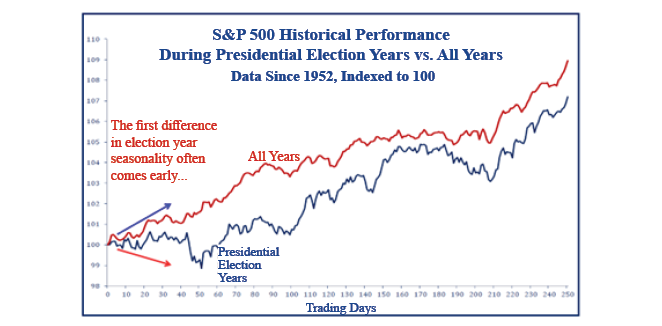
An encouraging indicator for 2024 is that presidential election years have usually been favorable for the S&P 500. Moreover, the index has not declined in an election year since 1952, when the incumbent President was running for re-election. A President seeking re-election and his administration are enormously incentivized to juice the economy leading up to Election Day. In our Chart of the Month, we compare the performance of election years with all years. The data reveals that turbulence often arrives around Super Tuesday (in early March) before climbing higher. As the road ahead is likely to be bumpy, investors should remain focused on their long-term goals and diversified in their portfolios.
Insights by John Silvia, Director of Economics

Expectations drive markets. Over the past two months, expectations of Fed easing have raced ahead. While our view remains that inflation and economic growth have moderated, the market’s expectations for the pace of Fed rate cuts have moved ahead of ours.
- Economic indicators signal moderating economic growth and inflation. Job gains have moderated along with capital goods orders. Meanwhile, jobless claims have remained steady, and consumer sentiment has improved.
- Job gains over the past three months have averaged 165,000—a distinct moderation from the 225,000 pace over the last 12 months. Private sector job gains have been the main culprit. Meanwhile, the unemployment rate has risen to 3.7%—above the rate of a year ago. Finally, growth in average hourly earnings has picked up to a 4.3% pace over the last three months, compared to 4.1% during the previous 12 months.
- The rise in average hourly earnings is a concern. The Fed uses this indicator as a benchmark for inflation. Therefore, this suggests caution on the extent of Fed easing already priced into financial assets.
- Consumer sentiment has improved. December’s index at 69.4 is above the level of three months ago. Both current assessment and expectations improved. Moreover, one-year inflation expectations moderated to 3.1%—an improvement but still above the Fed’s target.
- Inflation has moderated but remains sticky. Core measures of inflation remain above the Fed’s target. The core PCE deflator that serves as the benchmark for inflation for the Fed has slowed to a pace of 2.2% growth over the last three months, compared to 3.2% over the previous year. If the slowdown in inflation is viewed as sustainable by the Fed, this will open the door to an easing in 2024.
- The FOMC continues to signal its dependence on data. In his latest press conference, Chairman Powell cited that “policy will remain at a restrictive stance for some time until inflation was moving down sustainably toward the Committee’s objective.” While “sustainably toward” is tough to define, the current pace of wage/PCE numbers does not suggest that goal is being attained right now.
- The imbalance between projected federal debt finance and potential economic growth remains, as clients have pointed out at our meetings. This imbalance has pushed up real rates over the last nine months despite declining nominal rates and inflation. This remains a hurdle to asset valuations.
- For investors, one notable improvement recently was the gain in pre- and post-tax corporate profits. This development reflects the continued gains in final demand combined with improved productivity that has lowered unit labor costs.
- To follow our earlier commentaries, the forecast for sustained, higher long-run Treasury market interest rates, compared to the decade of 2012-2019, has indeed happened. As projected by the Congressional Budget Office, a continued rise in the federal debt-to-GDP ratio in the years ahead and the threat of another credit downgrade will be associated with higher real interest rates in the long term. While nominal interest rates have declined, real interest rates remain above the levels of the last decade.
- Lower interest rate expectations, reflecting a more neutral and less restrictive Fed policy, have delivered lower values for the U. S. dollar.
- While forecasts of recession have drifted away, U.S. financial markets continue to adjust to the economic reality of moderate but positive trend-like economic growth, higher-for-longer interest rates, and recently improved profit expectations. These factors support a more positive but cautious view of financial asset valuations relative to the challenges of 2022 and the first half of 2023.
Quote of the Month
“Compounding works best when you can give a plan years or decades to grow. This is true for not only savings but careers and relationships. Endurance is key. And when you consider our tendency to change who we are over time, balance at every point in your life becomes a strategy to avoid future regret and encourage endurance.”
Morgan Housel, American Investor and Author
Chart of the Month
The information published herein is provided for informational purposes only, and does not constitute an offer, solicitation or recommendation to sell or an offer to buy securities, investment products or investment advisory services. All information, views, opinions and estimates are subject to change or correction without notice. Nothing contained herein constitutes financial, legal, tax, or other advice. The appropriateness of an investment or strategy will depend on an investor’s circumstances and objectives. These opinions may not fit to your financial status, risk and return preferences. Investment recommendations may change, and readers are urged to check with their investment advisors before making any investment decisions. Information provided is based on public information, by sources believed to be reliable but we cannot attest to its accuracy. Estimates of future performance are based on assumptions that may not be realized. Past performance is not necessarily indicative of future returns. The following indexes were used as proxies in the performance tables: Global Stocks = MSCI ACWI; U.S. Large Cap = S&P 500; U.S. Large Value = Russell 1000 Value; U.S. Large Growth = Russell 1000 Growth; U.S. Small Cap = Russell 2000; Int’l Dev Stocks = MSCI EAFE; Emerging Markets = MSCI EM; U.S. Inv Grade Bonds = Barclays U.S. Aggregate; U.S. High Yield Bonds = Barclays Corporate High Yield; Emerging Markets Debt = JPMorgan EMBI Global Diversified; Int’l Bonds = Barclays Global Treasury ex US; Cash = 3month T-Bill; Sector returns displayed in the chart represent S&P 500 sectors, while treasury benchmarks are from Barclays
Source: Schwab Center for Financial Research with data provided by Morningstar, Inc., as of 3/31/2022. Asset class performance represented by annual total returns for the following indexes: S&P 500® Index (US Lg Cap), Russell 2000® Index (US Sm Cap), MSCI EAFE® Net of Taxes (Int’l Dev), MSCI Emerging Markets IndexSM (EM), MSCI US REIT Index (REITs), S&P GSCI® (Comm.), Bloomberg Barclays U.S. Treasury Inflation-Linked Bond Index (TIPS), Bloomberg Barclays U.S. Aggregate Bond Index (Core US Bonds), Bloomberg Barclays U.S. High Yield Bond Index (High Yield Bonds), Bloomberg Barclays Global Aggregate Ex-USD TR Index (Int’l Dev Bonds), Bloomberg Barclays Emerging Markets USD Bond TR Index (EM Bonds), FTSE U.S. 3-Month T-Bill Index (T-Bills). Past results are not an indication or guarantee of future performance. Returns assume reinvestment of dividends, interest, and capital gains. Indexes are unmanaged, do not incur fees or expenses, and cannot be invested in directly.
Chart of the Month: Strategas
Chart of the Month
Quote of the Month
“Compounding works best when you can give a plan years or decades to grow. This is true for not only savings but careers and relationships. Endurance is key. And when you consider our tendency to change who we are over time, balance at every point in your life becomes a strategy to avoid future regret and encourage endurance.”
Morgan Housel, American Investor and Author
Trailing Returns