Market Perspectives February 2023
Capital Markets
By: Wade Austin
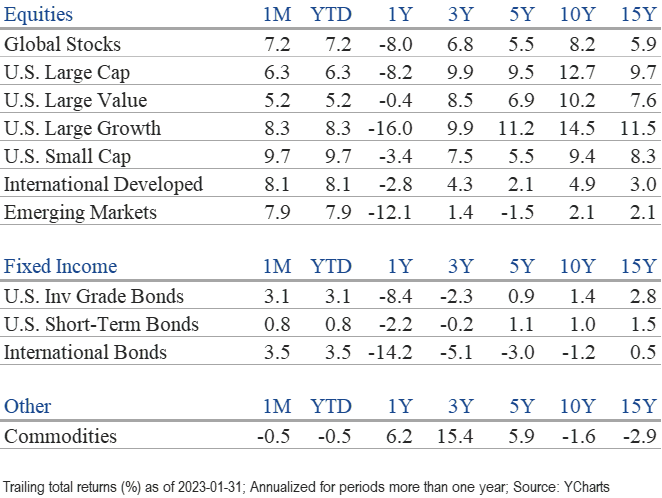
Investor optimism returned to global equity and bond markets in January after both asset classes suffered their worst returns in over a decade last year. Despite suggesting in last month’s Market Perspectives that clients avoid the temptation to be pessimistic entering 2023, we certainly were not expecting markets to rebound so robustly so soon. The S&P 500 (+6.3%) and Nasdaq Composite Index (+10.7%) posted their best January since 2009 and 2001.
The sharp reversal in markets can be portrayed as a sentiment rally. Overly bearish investors and negative consumer sentiment had nudged markets towards oversold conditions as fears of a well-telegraphed recession became priced into stocks and bonds. However, encouraging economic and inflation data released in January led to expectations for a near-term end to the Federal Reserve’s rate hikes. Not only did a recession suddenly appear unlikely to be imminent, but the odds of a “soft landing” increased. After a large wave of tax loss selling during Q4, investors rushed back into the market to reestablish exposure. Short sellers felt compelled to cover their positions, further contributing to the rally. Additionally, companies took advantage of their depressed stock prices by repurchasing their shares. Birinyi and Associates reported that U.S. companies tripled stock buybacks year-over-year in January.
The rally wasn’t exclusive to U.S. stocks. After beating the S&P 500 in Q4, international developed (+8.1%) and emerging market stocks (+7.9%) continued their outperformance in January. As noted last month, the weakening U.S. dollar provides a meaningful tailwind for foreign asset prices. U.S. small-cap stocks (+9.7%) also popped, bettering large caps after an extended period of underperformance.
Leadership within the S&P 500 experienced an extremely sharp reversion in January. Last year’s worst-performing quintile of stocks averaged a whopping 21% surge, while 2022’s best-performing quintile gained 2.1%. Tesla is a prime example. It lost 65% last year, then jumped 40.6% last month. On a sector basis, the performance flip-flop is just as dramatic. Consumer discretionary (+15.0%) was January’s top performer after plunging 36.2% in 2022. Conversely, energy, last year’s hero at +65.4%, gained a more modest 2.7%. Buying technology stocks during 2022 felt like catching a falling knife but became blissful again, popping 9.3%. Not all S&P 500 sectors posted gains. Three of the defensive sectors that protected capital so well in 2022 (utilities, health care, and consumer staples) declined 2.0%, 1.9%, and 0.9% respectively in January.
While the Fed has been signaling that interest rates need to be “higher for longer,” the bond market disagrees. Instead, bond yields mirrored inflation’s downward trend sparking a welcomed rally among all sectors of the U.S. fixed-income market. The 10-year U.S. Treasury note yield dropped 37 basis points during the month, ending January at 3.51%. While significantly above its recent 10-year average of 2.16%, it has retreated considerably from its 4.33% peak last October. As a result, the U.S. aggregate bond index rebounded to a 3.1% total return gain in January alone. U.S. investment-grade corporate bonds (+4.0%) were the top-performing fixed-income sector.
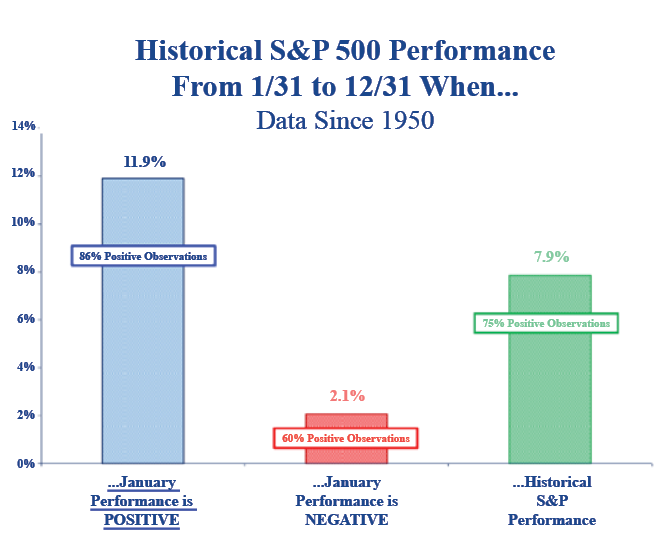
The momentum from a strong January often carries over throughout the remainder of the year. Our Chart of the Month indicates that the historical S&P 500 performance over the next 11 months after a positive January is four percentage points above average with a much better batting average.
However, an evolving set of market concerns are lingering. All eyes remain on the Fed. Longer-term Treasury yields have recently been in a tight trading range, but traders and analysts are on edge heading into every Fed meeting, inflation print, and jobs report. Based on reported Q4 corporate earnings results and guidance, analysts are revising downward estimates for 2023 full-year earnings. In distinct contrast, valuations reflect quite a bit of hopefulness. Forward P/E multiples have extended from 16.6x to 18.3x since the start of the year. Lastly, the yield curve remains deeply inverted. While it is true that an inverted yield curve preceded every recession, curve inversion can occur without a recession.
Slowing inflation, the approaching end of the rate-hike cycle, and increasing odds of a “soft landing” have provided the optimism to fuel this rally. The momentum may continue, but it doesn’t seem prudent to chase risk given the current fundamentals. Last month, I cautioned against being too pessimistic. Now, for the near term, I’m inclined to warn against the fear of missing out.
Insights by John Silvia, Director of Economics

Stay with the fundamentals. The three drivers of investment performance are continued economic growth, persistent inflation, and the Fed targeting higher interest rates.
- On the economic front, the employment report for January came in very strong and thereby supports the case for positive economic growth in the first half of 2023. This report also reduces the prospects of recession by the third quarter, as is prevalent in many outlooks. In support of the case for continued growth, initial jobless claims, a leading indicator, have declined compared to a month ago. Both components of the consumer sentiment index, current and expected, signaled an improvement in December.
- The impact of higher interest rates shows up in the slowdown of new orders and the shipment of durable goods. Housing also is negatively impacted by higher interest rates, but there is some improvement in pending and new home sales in the South. The latest Atlanta Fed “nowcast” does signal very modest GDP growth in the first quarter.
- Moderation in primary inflation gauges supports the case for further Fed rate increases, although the persistence of inflation indicates the Fed has several interest rate increases ahead. The Fed’s target inflation measure, core PCE deflator, is up just 2.9% over the last three months compared to 4.4% during the previous twelve months.
- Two of our leading indicators of inflation support expectations for continued lower inflation ahead.
- The Dallas Fed trimmed mean inflation rate in December was below the rate of September.
- The prices paid measure from the ISM-manufacturing survey has fallen to 44.5, below the 50.0 breakeven level. We expect that inflation will continue to decline in the year ahead.
- A slower pace of inflation still leaves the Federal Reserve far from its 2% inflation target. Therefore, the outlook is for the funds’ rate to remain “higher for longer.” Persistent inflation will prompt more Fed rate increases.
- Corporate profits and equity valuations are challenged on two fronts.
- First, the upward revision of interest rate expectations results in applying a higher discount factor on expected future earnings. In addition, higher interest rates represent increased debt financing costs and limit the potential of refinancing in the debt markets.
- Second, the rise in unit labor costs for businesses has impacted profit expectations. For equity investors, this is a hit on both top-line revenue and bottom-line expenses. Therefore, the outlook for corporate profits has deteriorated with some analysts forecasting an outright decline in pre-tax earnings in the year ahead.
- As an outlook, we focus on the next three-to-five-year horizon, given that such difficult periods eventually give way to better economic and financial times. However, this focus does include the expectation that interest rates will be higher for longer during this period.
- For fixed-income investors, the “higher for longer” theme from the Fed amplifies the case for a reassessment of market interest rates expectations and how the long-run path of inflation/rates will influence the returns on cash, bonds, and equities. Higher long-term sovereign and corporate bond rates have made selective fixed-income instruments more competitive on yield with equities.
- On net, our outlook is that the Fed’s pursuit of inflation stability will bias interest rates upward and slow economic growth. Profits remain under pressure as labor costs and interest rates rise.
Quote of the Month
“The only thing we know about the future is that it will be different.”
Dr. Peter Drucker – Austrian-American management consultant, educator, and author
Chart of the Month
The information published herein is provided for informational purposes only, and does not constitute an offer, solicitation or recommendation to sell or an offer to buy securities, investment products or investment advisory services. All information, views, opinions and estimates are subject to change or correction without notice. Nothing contained herein constitutes financial, legal, tax, or other advice. The appropriateness of an investment or strategy will depend on an investor’s circumstances and objectives. These opinions may not fit to your financial status, risk and return preferences. Investment recommendations may change, and readers are urged to check with their investment advisors before making any investment decisions. Information provided is based on public information, by sources believed to be reliable but we cannot attest to its accuracy. Estimates of future performance are based on assumptions that may not be realized. Past performance is not necessarily indicative of future returns. The following indexes were used as proxies in the performance tables: Global Stocks = MSCI ACWI; U.S. Large Cap = S&P 500; U.S. Large Value = Russell 1000 Value; U.S. Large Growth = Russell 1000 Growth; U.S. Small Cap = Russell 2000; Int’l Dev Stocks = MSCI EAFE; Emerging Markets = MSCI EM; U.S. Inv Grade Bonds = Barclays U.S. Aggregate; U.S. High Yield Bonds = Barclays Corporate High Yield; Emerging Markets Debt = JPMorgan EMBI Global Diversified; Int’l Bonds = Barclays Global Treasury ex US; Cash = 3month T-Bill; Sector returns displayed in the chart represent S&P 500 sectors, while treasury benchmarks are from Barclays
Source: Schwab Center for Financial Research with data provided by Morningstar, Inc., as of 3/31/2022. Asset class performance represented by annual total returns for the following indexes: S&P 500® Index (US Lg Cap), Russell 2000® Index (US Sm Cap), MSCI EAFE® Net of Taxes (Int’l Dev), MSCI Emerging Markets IndexSM (EM), MSCI US REIT Index (REITs), S&P GSCI® (Comm.), Bloomberg Barclays U.S. Treasury Inflation-Linked Bond Index (TIPS), Bloomberg Barclays U.S. Aggregate Bond Index (Core US Bonds), Bloomberg Barclays U.S. High Yield Bond Index (High Yield Bonds), Bloomberg Barclays Global Aggregate Ex-USD TR Index (Int’l Dev Bonds), Bloomberg Barclays Emerging Markets USD Bond TR Index (EM Bonds), FTSE U.S. 3-Month T-Bill Index (T-Bills). Past results are not an indication or guarantee of future performance. Returns assume reinvestment of dividends, interest, and capital gains. Indexes are unmanaged, do not incur fees or expenses, and cannot be invested in directly.
Chart of the Month: Strategas
Chart of the Month
Quote of the Month
“The only thing we know about the future is that it will be different.”
Dr. Peter Drucker – Austrian-American management consultant, educator, and author
Trailing Returns