Market Perspectives January 2023
Capital Markets
By: Wade Austin
2022 was a dismal year for markets and one most investors would love to forget. Stocks tumbled while bonds suffered their worst selloff ever. Even the highly reliable Santa Claus rally was a no-show last Christmas. The culprit was an overwhelming shift in the global macroeconomic landscape dominated by persistently high inflation, hawkish monetary policy, and formidable geopolitical tensions.
Having mischaracterized inflation’s steady increase throughout 2021 as “transitory,” the Federal Reserve a year ago expected to raise interest rates only three times totaling 75 bps for all of 2022. It’s easy to forget that, under such favorable projections, the S&P 500 reached an all-time high of 4,796 on the first trading day of 2022. But after Russia’s invasion of Ukraine sparked shockwaves to commodity prices worldwide, the Fed suddenly realized they were substantially “behind the curve” in combatting runaway consumer prices. They urgently hiked the federal funds rate an unprecedented seven times (from 0.25% to 4.5%), prioritizing price stability over the risks of causing a recession.
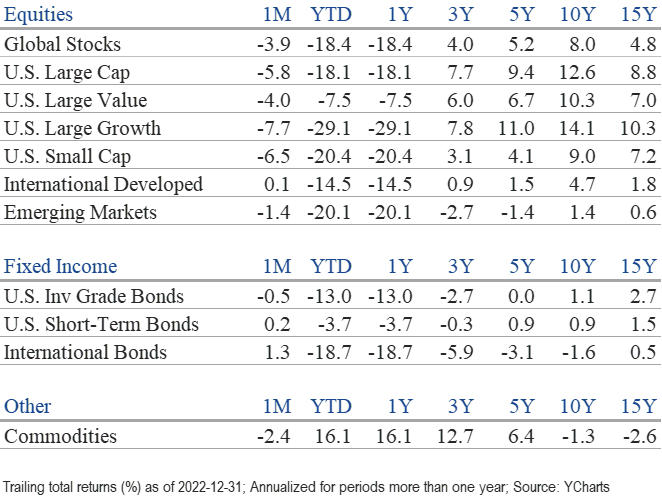
Confident that inflation was easing from its June peak of 9.1%, optimism returned to the stock market in October and November in anticipation that the Fed would pivot soon. However, markets sold off again in December after Fed Chairman Powell asserted rates needed to be “higher for longer.” The S&P 500 fell 5.8% in December but still managed a 7.6% gain for the fourth quarter. With the rebound off the September trough level of -25%, the U.S. large-cap index concluded 2022 at 3,840, a total return decline of 18.1%, and its worst performance since 2008.
Perhaps a surprising data point, DataTrek reported that just five trading days accounted for more than 95% of the index’s losses in 2022. However, missing the five best days would have worsened the damage by another 13.1 percentage points.
Rising interest rates weighed on stocks in the form of compressed P/E ratios. Corporate earnings were surprisingly resilient in 2022. Starting the year at much lower valuations, value stocks (-7.5%) had less room to fall and significantly outperformed richly priced growth stocks (-29.1%). Value stocks’ outperformance is best reflected in sector results. While all eleven equity sectors were down in December, only two posted gains in 2022, energy and utilities. The dispersion between the year’s top and worst performers – energy (+65.4%) and communication services (39.9%) was the largest in over 50 years.
In the overseas markets, developed international equities surged 17.4% during the fourth quarter, partly due to U.S. dollar weakness, after peaking in October. Emerging markets (+9.8%) also beat U.S. stocks in the fourth quarter. In the face of war in Ukraine, an energy crisis, and some economies already entering a recession, developed international equities (-14.0%) outperformed the S&P 500 by 4.1% in 2022.
Given positive stock-bond correlations in a sharply rising rate environment, bonds failed to offer protection against the stock market selloff. Commodities were the only asset class that worked in 2022, gaining 16.1%. 10-year U.S. Treasury yields began the year at 1.52%, peaked at 4.33% in October, and ended December at 3.88%. Despite posting a modest 1.9% gain for the fourth quarter, the U.S. aggregate bond index bonds logged their worst year ever (-13.1%).
According to research from The Leuthold Group, the conventional 60/40 portfolio (60% S&P 500 and 40% 10-year U.S. Treasury bonds) dropped a painful 16.8% and suffered its worst year since 1937. Also, 2022 was only the sixth year since 1877 when the total return for both benchmarks was negative. Our Chart of the Month lists what happened in the year following concurrent losses for stocks and bonds. In each of the previous cases, the economy went into recession at some point during the next year. Nonetheless, stocks and bonds recovered to post substantial gains in all but one of the following years.
Admittedly, five is a small sample size, and today’s forward P/E of 16.7 is higher than the starting point in prior recovery years. Markets enter 2023 plagued by many of the same uncertainties and risks as last year. The consensus view on Wall Street is that corporate earnings will be the next shoe to drop in 2023. However, we know stocks have historically rebounded six to nine months in advance of the trough in earnings.
The critical unresolved questions for markets are:
- When will be the Fed’s last rate hike?
- When will be the Fed’s first rate cut?
The precise timing is anyone’s guess. Until more clarity, we can expect continued volatility sparked by each monthly economic data release. Concerns and caution are justified, but we prefer to resist the temptation to be pessimistic now. Given that markets have already discounted a substantial slowdown, we expect long-term investors’ patience will be rewarded before signs of recovery become apparent.
Insights by John Silvia, Director of Economics

For investors, new data in recent weeks have turned positive for both the economy and inflation.
- On the economic front, consumer real disposable income has risen 2.5% over the last three months—a solid turnaround from the decline of 2.5% compared to a year ago. Job gains have been at a 247,000 pace over the previous three months while initial jobless claims, a leading indicator, have declined compared to a month ago.
- Other leading economic indicators have improved. Consumer sentiment is up over values of three months ago. New orders and shipments of durable goods in November are up over September values. Housing remains the one sector of the economy that continues to slide in response to rate increases by the Fed. In sum, the Atlanta Fed GDPNow estimate has growth at 3.9% for the fourth quarter.
- Inflation has been the major challenge to the markets. However, recent inflation data has improved investor prospects. First, the Fed’s preferred inflation measure, the core PCE deflator, is up just 3.6% over the last three months compared to 4.7% over the previous twelve months. Second, two of our leading indicators of inflation support expectations for continued declines ahead. The Dallas Fed trimmed mean inflation rate in November is below the rate of September. Also, the prices paid measure from the ISM-manufacturing survey has fallen to 39.4, below the 50 breakeven levels. We expect inflation to continue to decline as expected from the next CPI report on January 12th.
- A slower pace of inflation still leaves the Federal Reserve far from its 2% inflation target. Therefore, the outlook is for the funds rate to remain “higher for longer.” Higher Inflation has promoted more and larger fed policy actions than were expected in 2022. We expect another 50bp rise in the funds rate on Feb. 1st, the next Fed meeting.
- Corporate profits and equity valuations are challenged on two fronts. The upward revision of interest rate expectations results in applying a higher discount factor on expected future earnings. In addition, higher interest rates represent a higher cost of debt financing and limit the potential of refinancing in the debt markets.
- Meanwhile, a rise in business unit labor costs has impacted profit expectations. For equity investors, this is a hit on both top-line revenue and bottom-line expenses. Therefore, the outlook for corporate profits has deteriorated, with some analysts forecasting an outright decline in pre-tax earnings in the year ahead.
- U.S. financial markets continue to adjust to the economic reality of moderate growth and higher interest rates but lower profit expectations for the year ahead. In the third quarter of last year, profit growth was up only 0.3%, far below the pace of profit growth in the first half of the year.
- As an outlook, we retain our focus on the next three-to-five-year horizon, given that such difficult periods eventually give way to better economic and financial times. However, this focus does include the expectation that interest rates will be higher for longer during this period.
- Our investment and economic focus on the future reflects our experience that U.S. economic growth returns to trend growth of 2.0% – 2.5% and that the Fed is addressing the inflation problem rather than assuming it away. This is a core belief in our strategy.
- The U.S. dollar’s international value is also subject to the flow of expectations. In recent weeks, the U.S. dollar’s value declined, with the expectation that the Fed would ease interest rates soon. However, most recent data has brought that expectation of a weaker dollar to a halt. In addition, more data on the Euro and U.K. economies reinforce the expectations for a recession over there and, therefore, better investment returns in the U.S. markets.
- For fixed income investors, the “higher for longer” theme amplifies the case for a reassessment of market interest rate expectations and how the long-run path of inflation and rates will influence the returns on cash, bonds, and equities. Higher long-term sovereign and corporate bond rates have made select fixed income instruments more competitive on yield with equities.
- Our outlook remains for modest but subpar economic growth, with the acknowledged risk of recession, given the heightened pursuit of slower inflation exhibited by the Fed.
Quote of the Month
“We don’t have to be smarter than the rest. We have to be more disciplined than the rest.”
Warren Buffett – American business magnate, investor, and philanthropist
Chart of the Month

The information published herein is provided for informational purposes only, and does not constitute an offer, solicitation or recommendation to sell or an offer to buy securities, investment products or investment advisory services. All information, views, opinions and estimates are subject to change or correction without notice. Nothing contained herein constitutes financial, legal, tax, or other advice. The appropriateness of an investment or strategy will depend on an investor’s circumstances and objectives. These opinions may not fit to your financial status, risk and return preferences. Investment recommendations may change, and readers are urged to check with their investment advisors before making any investment decisions. Information provided is based on public information, by sources believed to be reliable but we cannot attest to its accuracy. Estimates of future performance are based on assumptions that may not be realized. Past performance is not necessarily indicative of future returns. The following indexes were used as proxies in the performance tables: Global Stocks = MSCI ACWI; U.S. Large Cap = S&P 500; U.S. Large Value = Russell 1000 Value; U.S. Large Growth = Russell 1000 Growth; U.S. Small Cap = Russell 2000; Int’l Dev Stocks = MSCI EAFE; Emerging Markets = MSCI EM; U.S. Inv Grade Bonds = Barclays U.S. Aggregate; U.S. High Yield Bonds = Barclays Corporate High Yield; Emerging Markets Debt = JPMorgan EMBI Global Diversified; Int’l Bonds = Barclays Global Treasury ex US; Cash = 3month T-Bill; Sector returns displayed in the chart represent S&P 500 sectors, while treasury benchmarks are from Barclays
Source: Schwab Center for Financial Research with data provided by Morningstar, Inc., as of 3/31/2022. Asset class performance represented by annual total returns for the following indexes: S&P 500® Index (US Lg Cap), Russell 2000® Index (US Sm Cap), MSCI EAFE® Net of Taxes (Int’l Dev), MSCI Emerging Markets IndexSM (EM), MSCI US REIT Index (REITs), S&P GSCI® (Comm.), Bloomberg Barclays U.S. Treasury Inflation-Linked Bond Index (TIPS), Bloomberg Barclays U.S. Aggregate Bond Index (Core US Bonds), Bloomberg Barclays U.S. High Yield Bond Index (High Yield Bonds), Bloomberg Barclays Global Aggregate Ex-USD TR Index (Int’l Dev Bonds), Bloomberg Barclays Emerging Markets USD Bond TR Index (EM Bonds), FTSE U.S. 3-Month T-Bill Index (T-Bills). Past results are not an indication or guarantee of future performance. Returns assume reinvestment of dividends, interest, and capital gains. Indexes are unmanaged, do not incur fees or expenses, and cannot be invested in directly.
Chart of the Month: Strategas
Chart of the Month
Quote of the Month
“We don’t have to be smarter than the rest. We have to be more disciplined than the rest.”
Warren Buffett – American business magnate, investor, and philanthropist
Trailing Returns