Market Perspectives – February 2020
Capital Markets
By: Wade Austin
U.S equity markets began the new decade seamlessly from 2019. The S&P 500 advanced 3% by mid-January fueled primarily by optimism surrounding the phase one trade deal with China. Once the coronavirus surfaced, a flight to safety ensued with the S&P 500 ending the month flat, while U.S. 10-yr. Treasury yields dropped from 1.92% to 1.52% posting a 3.71% total return.
We wrote in November about the markets’ uncanny ability to climb the perpetual Wall of Worry. While the trade war topped the list of fears in 2019, it is a bit ironic that a totally unexpected crisis from China has now struck at the foundation of the recent market upturn.
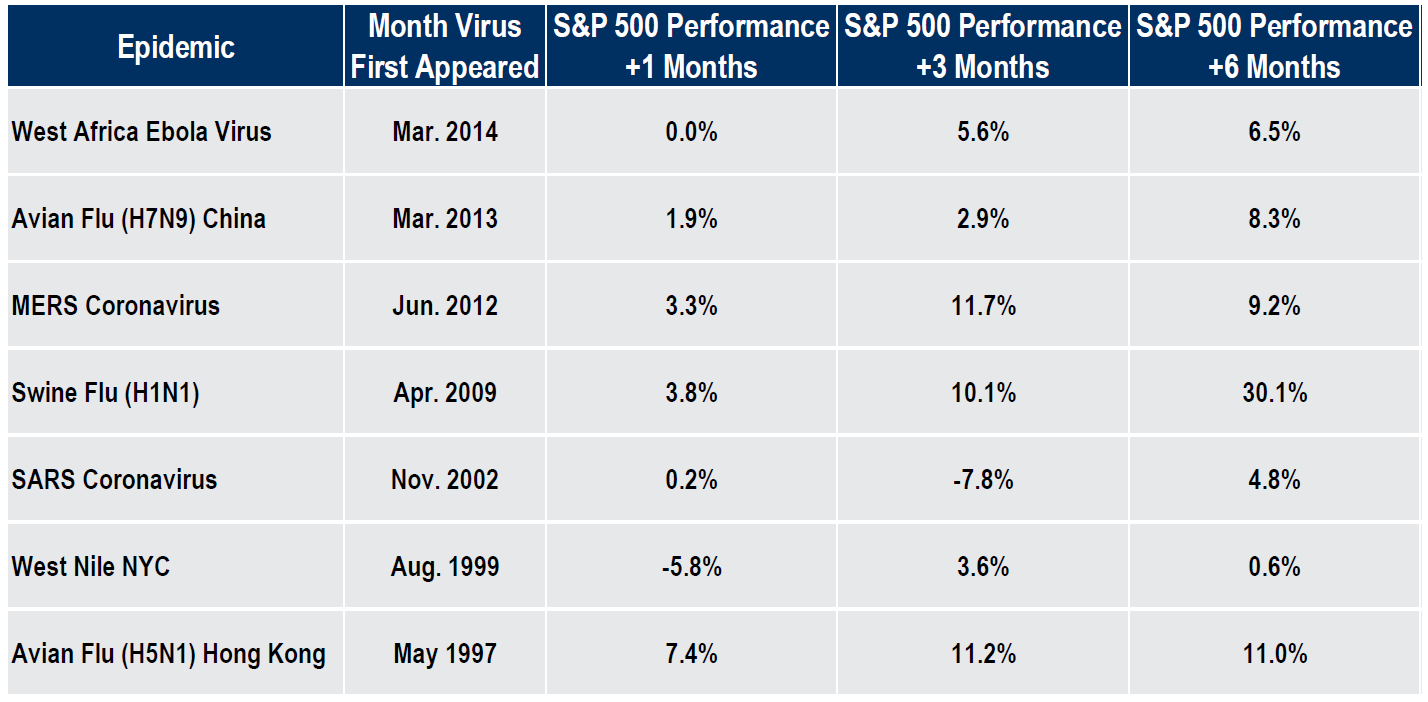
Our Chart of the Month below indicates that past outbreaks have had little to no long-term impact on markets. While that may prove the case again this time, the advent of social media and the 24×7 news cycle increases the potential for a short-term global economic slowdown due to abundant precautions. Given the global economy was just beginning to show signs of recovery, the coronavirus has justifiably dampened investor sentiment. Also, the first quarter of an election year has historically been choppy.
However, if the economic hit were to prove more meaningful, soft conditions would likely attract more prescriptive measures in the form of monetary and fiscal policies globally. The combination of dampened expectations and further stimulus could be a powerful boost for global economic growth and equity markets.
As the coronavirus’s impact on markets hopefully will prove to be short-term turbulence, long-term investors should remain patient with their diversified investment plan to avoid regrettable investment mistakes.
Insights by John Silvia, Director of Economics

Steady Policy in a Swirl of Volatility
For now, but who knows how long, monetary policy at the Fed is steady with “global developments” square in their sights. Yet, the latest inflation data came in at 1.3% for the core PCE deflator – significantly below the Fed’s 2% target. As a result, the Fed will lean toward continued easing. For investors, the immediate impact is the Fed will continue to buy T-Bills to supply liquidity to the markets. Thus, expect the yields on short-term Treasury debt (e.g., 2- and 5-yr. Treasury notes) to remain lower than a year ago and thereby support consumer spending and housing markets.
China—A Swirl of Volatility
Investment implications for coronavirus are so difficult because the paradigm for the outlook for global growth, trade and commodity prices has broken down. China’s evolution has been a positive for global growth over the past 10 years. For trade, the links between China, emerging Asia and the U.S. has increased the prosperity for all nations involved.
What to do?
Uncertainty about the operating paradigm leads global investors to buy U.S. Treasury debt and the safe-haven currencies of the dollar, yen and Swiss franc. The volatility and uncertainty of China/coronavirus continues to provide the basis for an outlook for continued low inflation and interest rates and slower global growth in 2020 versus 2019.
Quote of the Month
“When all the experts and forecasts agree, something else is going to happen.”
Bob Farrell
Chart of the Month
The information published herein is provided for informational purposes only, and does not constitute an offer, solicitation or recommendation to sell or an offer to buy securities, investment products or investment advisory services. All information, views, opinions and estimates are subject to change or correction without notice. Nothing contained herein constitutes financial, legal, tax, or other advice. The appropriateness of an investment or strategy will depend on an investor’s circumstances and objectives. These opinions may not fit to your financial status, risk and return preferences. Investment recommendations may change, and readers are urged to check with their investment advisors before making any investment decisions. Information provided is based on public information, by sources believed to be reliable but we cannot attest to its accuracy. Estimates of future performance are based on assumptions that may not be realized. Past performance is not necessarily indicative of future returns. The following indexes were used as proxies in the performance tables: Global Stocks = MSCI ACWI; U.S. Large Cap = S&P 500; U.S. Large Value = Russell 1000 Value; U.S. Large Growth = Russell 1000 Growth; U.S. Small Cap = Russell 2000; Int’l Dev Stocks = MSCI EAFE; Emerging Markets = MSCI EM; U.S. Inv Grade Bonds = Barclays U.S. Aggregate; U.S. High Yield Bonds = Barclays Corporate High Yield; Emerging Markets Debt = JPMorgan EMBI Global Diversified; Int’l Bonds = Barclays Global Treasury ex US; Cash = 3month T-Bill; Sector returns displayed in the chart represent S&P 500 sectors, while treasury benchmarks are from Barclays
Sources: CIC, Morningstar Direct, and The Leuthold Group
Chart of the Month
Quote of the Month
“When all the experts and forecasts agree, something else is going to happen.”
Bob Farrell