Market Perspectives July 2021
Capital Markets
By: Wade Austin
The US economy has not completely recovered from the pandemic yet booming economic activity during Q2 propelled the S&P 500 to an all-time closing high of 4,297 on June 30th- its 34th new closing high of the year. Its 15.3% total return YTD marked the 13th best first half of the year since 1950 and bettered the broader, MSCI ACWI global equity benchmark’s total return of 12.3%.
Shock and awe fiscal stimulus, ultra-accommodative monetary policy, elevated personal savings levels, and pent-up demand after unprecedented lockdowns have energized consumer spending above pre-Covid levels for both high- and low-income earners. While the labor market is less repaired (a 5.9% unemployment rate despite 9.2M open job postings), corporate earnings are surging because of stellar productivity gains. FY 2021 earnings growth estimates of 23% in January were revised upward to 40% by June. FY 2022 earnings growth estimates are 12%. For perspective, the average annual earnings growth rate since 1950 is only 6%.
Addressing the associated inflation fears, the Fed surprised markets at its mid-June FOMC meeting with a hawkish projection of two interest rate hikes in 2023. The Fed continues to assert that recent inflation spikes are transitory but signaled they would be willing to tighten monetary policy sooner than markets were expecting.
After overreacting initially, markets appear aligned with this assessment of inflation. The contraction in 10-Yr U.S. Treasury note yield resumed closing at 1.44% on June 30th, 13 bps lower for the month and 30 bps below the prior peak of 1.74% on March 31st. The U.S. aggregate bond index posted a positive 0.70% return for the month but is still negative for the first half (-1.6%) given the 10-Yr yield began the year at 0.92%
Despite the rotation from cyclicality back to growth in June, value stocks outperformed growth, small caps beat large, and the U.S. beat International and EM in the first half. All 11 sectors gained ground led by Energy (+45.6%) and were trailed by Utilities (+2.5%). Commodities were the big winner as its composite benchmark index gained 21.2%.
While the S&P 500 posted its 5th consecutive month of gains in June (+2.3%), declining stocks outnumbered gainers. Market breadth has waned from vigorous levels in the Spring. The reflation trade that boosted value stocks and bond yields has reversed as markets digest potential threats to the global growth outlook, namely Covid variants, a dependency on stimulus and deficits, inflation, supply shortages, and a flattening yield curve. Tech stocks, which had lagged since September, reached a 3-month high (relative to the S&P 500) in late June. The direction of the U.S. dollar and inflation will be key indicators in determining if cyclicality resumes leadership during Q3.
The market’s overall trend is strong. The U.S. is now the most resilient Covid economy, and our corporations will continue to embrace productivity improvements. Given those technological solutions are largely provided by U.S. businesses, U.S. relative outperformance may extend longer than many expect.
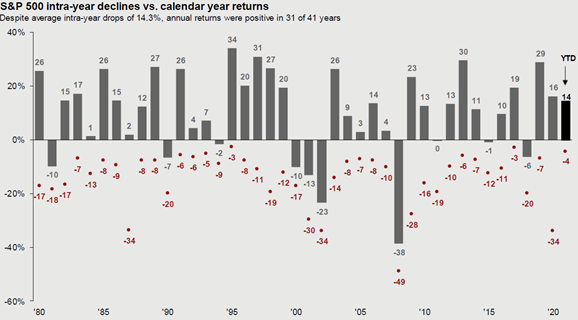
As we enter the softest part of the calendar for equities (July and August, historically), we feel it is prudent to guard against complacency, especially amidst a period of extended low volatility. Since the vaccine announcement on November 9th, the S&P 500 has gained 25.5% while enduring a maximum drawdown of only -4%. As shown in our Chart of the Month, an intra-year drawdown of -4% or less has occurred only twice since 1980. The average intra-year drawdown is -14.3%.
It is never a straight line for markets. However, sound portfolio diversification and realistic expectation setting are the best tools for withstanding sudden shocks, staying invested, and, therefore, achieving long-term financial goals.
Insights by John Silvia, Director of Economics

Good news from economic indicators suggests that for the rest of this year, the economic outlook remains positive with growth above the two percent long-run trend. Leading indicators such as jobless claims, factory orders/shipments, building permits, and consumer sentiment have provided a reliable gauge of the path of the economy.
- For all of 2021, economic growth is expected to be six percent plus with strong gains in consumer spending, residential investment, and business investment. Inflation rates have risen over the past year and are expected to present some challenges to investors.
- In early June, inflation and growth expectations picked up with benchmark ten-year yields rising in response. However, more recently, the decline in jobless claims and the ISM services index has flattened out intimating slower economic growth, as was expected, but the capital markets lowered their pricing of future inflation and any Fed tightening in policy. As a result, benchmark Treasury yields have declined in the last few weeks.
- As consistent with Fed policy intentions, our expectation is that rising inflation and benchmark interest rates along with a steady decline in the U.S. dollar value promotes caution in the outlook for financial assets. In the very recent past, yields have declined, but the longer-run view, consistent with Fed intentions, is for higher inflation and interest rates.
- Even within an economic expansion, there are periods of accelerating and decelerating growth/inflation benchmarks that can distract from the long-run goals of investors. Investment opportunities and risks change as the economic recovery evolves often due to changes in inflation, interest rates, and the value of the dollar. In addition, a new political administration has introduced new priorities with respect to taxes, energy development, and infrastructure. All of these require further review of your portfolio.
Clients have been rewarded by following the fundamentals and taking a longer view of their position. Recessions are part of the economic cycle, but recovery and expansion are longer lasting. This has not changed.
Quote of the Month
“People invest in stocks for two opposite reasons — in hope and confidence in the future of an enterprise or in fear that the value of their capital will be lost through inflation.”
Bernard Baruch, American Financier
Chart of the Month
The information published herein is provided for informational purposes only, and does not constitute an offer, solicitation or recommendation to sell or an offer to buy securities, investment products or investment advisory services. All information, views, opinions and estimates are subject to change or correction without notice. Nothing contained herein constitutes financial, legal, tax, or other advice. The appropriateness of an investment or strategy will depend on an investor’s circumstances and objectives. These opinions may not fit to your financial status, risk and return preferences. Investment recommendations may change, and readers are urged to check with their investment advisors before making any investment decisions. Information provided is based on public information, by sources believed to be reliable but we cannot attest to its accuracy. Estimates of future performance are based on assumptions that may not be realized. Past performance is not necessarily indicative of future returns. The following indexes were used as proxies in the performance tables: Global Stocks = MSCI ACWI; U.S. Large Cap = S&P 500; U.S. Large Value = Russell 1000 Value; U.S. Large Growth = Russell 1000 Growth; U.S. Small Cap = Russell 2000; Int’l Dev Stocks = MSCI EAFE; Emerging Markets = MSCI EM; U.S. Inv Grade Bonds = Barclays U.S. Aggregate; U.S. High Yield Bonds = Barclays Corporate High Yield; Emerging Markets Debt = JPMorgan EMBI Global Diversified; Int’l Bonds = Barclays Global Treasury ex US; Cash = 3month T-Bill; Sector returns displayed in the chart represent S&P 500 sectors, while treasury benchmarks are from Barclays
Source: Chart of the Month – J.P. Morgan
Chart of the Month
Quote of the Month
“People invest in stocks for two opposite reasons — in hope and confidence in the future of an enterprise or in fear that the value of their capital will be lost through inflation.”
Bernard Baruch, American Financier
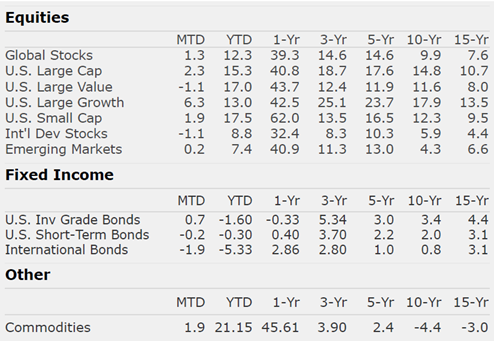
Trailing Returns