Market Perspectives April 2022
Capital Markets
By: Wade Austin
The first three months of 2022 proved to be traumatic for the world and challenging for investors. Soaring inflation, the tragic Russian invasion of Ukraine, a new global central bank tightening and interest rate hike cycle, surging oil and other critical commodity prices, continued supply-chain bottlenecks, China Covid-lockdowns, and weakening consumer confidence made for a long and complex mix of headwinds for markets to digest.
Heightened geopolitical, fiscal, and monetary policy uncertainty pressured global stocks and bonds into early March when the S&P 500 (-13%) bottomed into correction territory. Both the NASDAQ (-22%) and Russell 2000 small-cap stocks (-21%) experienced bear market declines from their late 2021 peaks to March troughs.
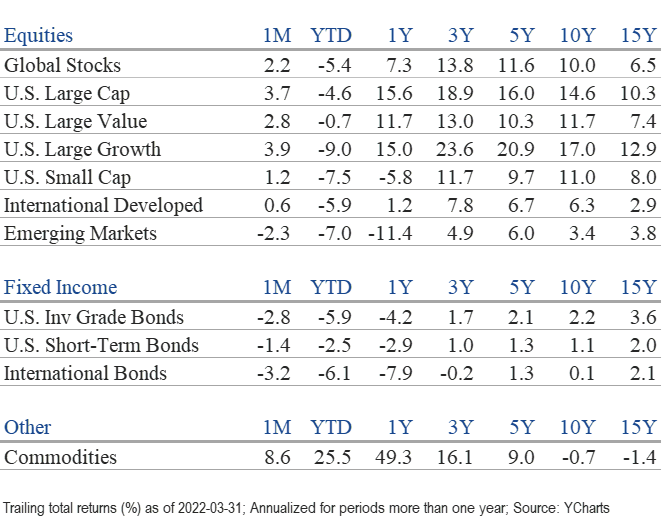
However, as Ukraine’s steadfast resolve helped abate worst-case war scenarios, global equities rallied sharply off their Q1 troughs – S&P 500 +8.6%, NASDAQ +13.0%, and Russell 2000 +7.2%. While it is remarkable that global equities rallied in March above their level when the war began, they still experienced their worst quarter since March 2020. U.S large-caps (-4.6%) fared better than developed international (-4.8%) and emerging market stocks (-7.0%) as well as U.S. small-caps (-7.5%).
For the month of March, 10 of 11 major sectors comprising the S&P 500 posted gains. Utilities was the top performer (+10.4%), while Financials (-1.9%) was the laggard. Energy (+39.0%) and Utilities (+4.8%) were the only two sectors posting gains for the quarter. Communication Services (-11.9%) was the worst performer.
Growth stocks, which were hit the hardest from peak to trough, rebounded fastest in March but still experienced much more severe declines (-9.0%) than value stocks (-0.7%) by the quarter’s end. Among international developed market stocks, the bifurcation between value (+2.5%) and growth stocks (-10.7%) was even greater.
For all the angst in equity markets, U.S. bonds suffered their worst quarter since 1980. Soaring inflation motivated a suddenly hawkish Fed to raise rates in March for the first time since 2018. The yield on the benchmark 10-year Treasury jumped 51 basis points (bps) in March and 83 bps for the quarter. The 2-year Treasury yield rose at double that pace (161 bps) to 2.34%, matching the 10-year yield and sparking yield curve inversion worries. The U.S. Bloomberg aggregate bond and municipal bond indexes posted total returns for the quarter of -5.9% and -6.2%, respectively.
Commodities were the lone bright spot. Most individual commodity prices skyrocketed during the first quarter led by coal up 99%, gas 79%, wheat 53%, and Brent oil 37%. Gold, silver, and copper rose only single digits. After generating a negative annual return for the prior 15 years, the Bloomberg commodity index surged 27% during 2021 and another 25.5% to start 2022, their best quarter since 1990.
Despite global equities’ March rally, it appears likely that elevated market volatility will continue. Near-term uncertainty relating to inflation, Fed tightening, and the war warrants a more cautious outlook. Yet, leading economic indicators still suggest moderate growth and a constructive view on risk assets. With the range of potential outcomes especially fluid, the benefits of portfolio diversification offer an attractive hedge against such heightened, near-term uncertainty.
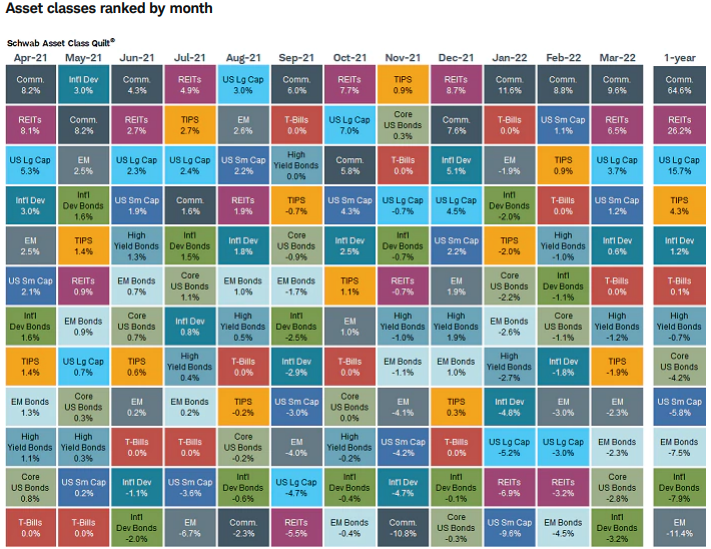
Our Chart of the Month, which stack ranks major asset class performance monthly over the past year, reveals how tricky recent investment performance has been. While commodities performed the best over the last 12 months, they also ranked at the bottom for two months. Conversely, emerging market equities were the past year’s worst performer but experienced three top-quartile months.
Insights by John Silvia, Director of Economics

Three major challenges persist from our discussion last month: inflation, monetary policy, and the Russia/Ukraine conflict.
- Benchmark inflation rates remain high as evidenced by Core PCE inflation, the target of Fed policy. Core PCE was 5.6% for the last three months, as of February, and 5.4% over a year ago. These numbers are significantly above the Fed’s target of 2%.
- From the ISM manufacturing survey, the prices paid index came in at 87.1, a level above both the fourth and third quarter averages. The price pressures gauge released by the Federal Reserve Bank of St. Louis came in at an all-time high.
- Higher inflation will imply persistent increases in the federal funds rate and benchmark 2-year, 5-year, and 10-year interest rates. At this point, commentators have interpreted an inverted yield curve as a signal of a recession ahead. Yet, corporate bond spreads have not widened significantly, and leading indicators still signal economic growth over the next six months.
- For investors, the conflict between Russia and Ukraine continues to have pervasive impacts on economic growth (profits), inflation, interest rates, and the dollar exchange rates. Economic growth expectations have dropped as inflation has reduced both real disposable personal income and consumer confidence. Slower Euro-area growth is also in the cards.
- Finally, the U.S. dollar has risen in value as a haven for global investors. The dollar has also benefitted from the liquidity payments issue for the Russian ruble.
- Therefore, the outlook remains for modest economic growth in 2022 (certainly below the pace of 2021) and persistent inflation above the Fed’s target reinforcing the need for Fed policy rate increases in both May and June.
- Meanwhile, slower economic growth and higher interest rates translate into lower profit growth in 2022 relative to 2021 and thereby a tougher investment horizon for equities and corporate debt.
- Why does the outlook for economic growth remain positive? February’s employment report came in with solid job gains and a slight improvement in labor force participation. In addition, the unemployment rate fell again to 3.6%.
- Meanwhile, the latest survey of manufacturing purchasing agents provides further evidence of growth. With the overall index at 57.1, its components of new orders, production, and employment remain above the breakeven level in expansion territory. The employment component indicates further job gains and thereby personal income and spending growth. However, the order backlogs and supplier deliveries index intimate that supply chain issues remain an issue.
- For investors, the current environment presents challenges. First, slower economic growth tends to be associated with slower profit growth, especially in an environment of rising interest rates. Second, core consumer inflation is a challenge for fixed income investors as real returns on cash and sovereign debt continue negative. With the Federal Reserve now committed to reducing its expansionary policy, the stage is now set for additional volatility in financial asset prices.
Quote of the Month
“The idea that a bell rings to signal when to get into or out of the stock market is simply not credible. After nearly fifty years in this business, I don’t know anybody who has done it successfully and consistently. I don’t even know anybody who knows anybody who has.”
Jack Bogle – American Investor and Founder of The Vanguard Group
Chart of the Month
The information published herein is provided for informational purposes only, and does not constitute an offer, solicitation or recommendation to sell or an offer to buy securities, investment products or investment advisory services. All information, views, opinions and estimates are subject to change or correction without notice. Nothing contained herein constitutes financial, legal, tax, or other advice. The appropriateness of an investment or strategy will depend on an investor’s circumstances and objectives. These opinions may not fit to your financial status, risk and return preferences. Investment recommendations may change, and readers are urged to check with their investment advisors before making any investment decisions. Information provided is based on public information, by sources believed to be reliable but we cannot attest to its accuracy. Estimates of future performance are based on assumptions that may not be realized. Past performance is not necessarily indicative of future returns. The following indexes were used as proxies in the performance tables: Global Stocks = MSCI ACWI; U.S. Large Cap = S&P 500; U.S. Large Value = Russell 1000 Value; U.S. Large Growth = Russell 1000 Growth; U.S. Small Cap = Russell 2000; Int’l Dev Stocks = MSCI EAFE; Emerging Markets = MSCI EM; U.S. Inv Grade Bonds = Barclays U.S. Aggregate; U.S. High Yield Bonds = Barclays Corporate High Yield; Emerging Markets Debt = JPMorgan EMBI Global Diversified; Int’l Bonds = Barclays Global Treasury ex US; Cash = 3month T-Bill; Sector returns displayed in the chart represent S&P 500 sectors, while treasury benchmarks are from Barclays
Source: Schwab Center for Financial Research with data provided by Morningstar, Inc., as of 3/31/2022. Asset class performance represented by annual total returns for the following indexes: S&P 500® Index (US Lg Cap), Russell 2000® Index (US Sm Cap), MSCI EAFE® Net of Taxes (Int’l Dev), MSCI Emerging Markets IndexSM (EM), MSCI US REIT Index (REITs), S&P GSCI® (Comm.), Bloomberg Barclays U.S. Treasury Inflation-Linked Bond Index (TIPS), Bloomberg Barclays U.S. Aggregate Bond Index (Core US Bonds), Bloomberg Barclays U.S. High Yield Bond Index (High Yield Bonds), Bloomberg Barclays Global Aggregate Ex-USD TR Index (Int’l Dev Bonds), Bloomberg Barclays Emerging Markets USD Bond TR Index (EM Bonds), FTSE U.S. 3-Month T-Bill Index (T-Bills). Past results are not an indication or guarantee of future performance. Returns assume reinvestment of dividends, interest, and capital gains. Indexes are unmanaged, do not incur fees or expenses, and cannot be invested in directly.
Chart of the Month
Quote of the Month
“The idea that a bell rings to signal when to get into or out of the stock market is simply not credible. After nearly fifty years in this business, I don’t know anybody who has done it successfully and consistently. I don’t even know anybody who knows anybody who has.”
Jack Bogle – American Investor and Founder of The Vanguard Group
Trailing Returns