Market Perspectives September 2022
Capital Markets
By: Wade Austin
The summer rally (that began mid-June, gained impressive momentum in July, and broadened during early August) lifted asset prices across the board. With Q2 corporate earnings proving more resilient than expected, S&P 500 breadth surged to bullish levels. The NASDAQ rebounded 20% off its June lows, officially transitioning to a new bull market. Just when the consensus felt the summer relief rally was morphing into a more powerful, durable advance, Federal Reserve Chairman Jerome Powell sunk markets with a single, brief speech from the annual Jackson Hole, Wyoming economic symposium.
Despite evidence that inflation has peaked, Powell warned the Fed must continue hiking rates to control inflation, which would also “bring pain to households and businesses.” Powell’s harsh rhetoric dashed the market’s outlook for a near-term Fed pivot, thereby sinking both stocks and bonds.
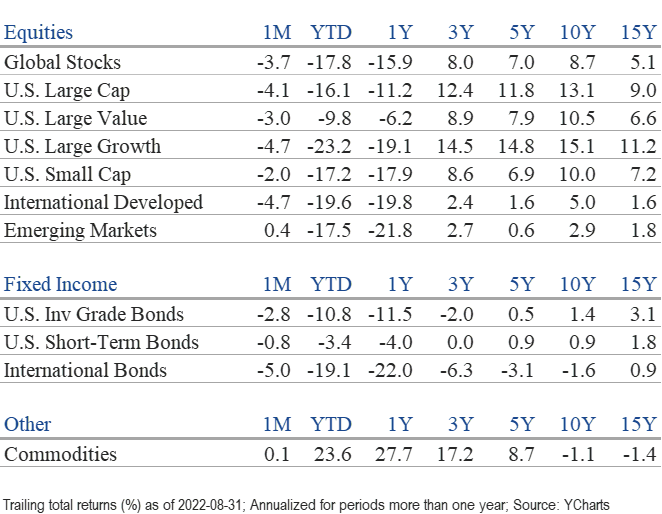
After climbing 4% to start August, the S&P 500 quickly retreated, posting a 4.1% decline for the month. The reversal of the technology-heavy NASDAQ index was more extreme as 6% mid-month gains swiftly flipped to 5% losses during the month’s last two weeks. Of the eleven major S&P 500 sectors, only energy (+2.8%) and utilities (+0.5%) were up in August. Information technology (-6.1%) and health care (-5.8%) were the weakest performers.
Developed international stocks retreated (-4.7%) due to escalating energy supply and recession fears. Inflation rose to a 40-year high of 10.1% in the U.K. and 9.1% in Europe. A better economic outlook for many emerging markets helped its index post a modest 0.4% gain in August, led by Brazil (+6.5%).
After clawing back to a single-digit decline, the sudden mid-month reversal dropped the S&P 500’s August YTD total return to -16.1%. Growth stocks outperformed during the summer rally, but the mostly defensive nature of value stocks has protected far better during this bear market (-9.8% vs. -23.2% YTD).
Treasury yields had declined in July, but Powell’s hawkish tone pushed yields higher across the yield curve. Markets quickly priced in another outsized increase at the Fed’s September meeting. 10-year Treasury yields jumped from 2.64% to 3.13% in August, while the 2-year yields spiked even more (2.9% to 3.44%). Although rates are still not high by historical measures, the impact of their dramatic increase cannot be overstated. Twelve months ago, 10-year and 2-year yields were 1.3% and 0.2%, respectively.
As a result, fixed income markets are off to their worst start in over 200 years. The Bloomberg U.S. Aggregate Index declined on a total return basis 2.8% in August and 10.8% YTD. The bond market outside the U.S. has been crushed far more harshly. The Bloomberg Global Aggregate Ex-U.S. Index has declined a whopping 19.1% YTD and 22.5% over the past 12 months. While bonds typically protect during years when stocks sell off, this year has been a painful exception. The traditional 60/40 portfolio (60% S&P 500 /40% Bloomberg U.S. Agg.) continues to produce its worst year (-13.9%) since 1976. The second worst was -9.5% in 2002.
Continued uncertainty associated with rising rates, robust inflation, the war between Russia and Ukraine, China’s zero-tolerance Covid policy, and European energy shortages suggests market volatility will remain elevated. Conversely, midterm elections have historically been a positive catalyst for U.S. stocks, regardless of party results.
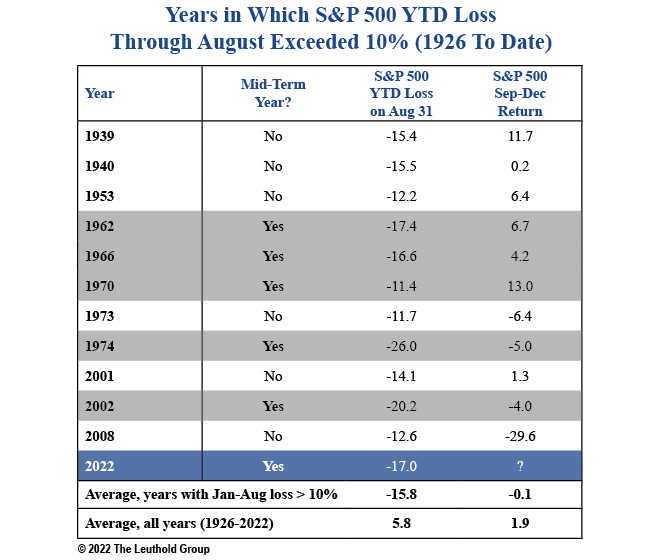
Our Chart of the Month examines the S&P 500’s 3rd-trimester performance during the 11 years since 1926, when its August YTD loss exceeded 10%. While the average of these troubled years’ September – December returns lagged the all-years average, the subset of midterm years outperformed. Extending the forward-returns time horizon, the S&P 500 has advanced every 12-month period following midterm elections since 1946.
Insights by John Silvia, Director of Economics

For several months now, the economic soup has been a negative broth of slower economic growth, persistent inflation, and higher policy-determined interest rates. Moreover, there is not a clear path out of our economic problems, and the uncertainty reigns on the outlook. In such periods, we retain our focus on the next 3- to 5-year time horizon given that such difficult periods do eventually give way to better economic and financial times.
- Our investment/economic focus on the future reflects our confidence that U.S. economic growth will return to trend growth of 2.0% – 2.5%, and the Fed is addressing the inflation problem rather than assuming it away.
- Persistent, sticky price inflation for many fundamental goods and services brings with it another challenge to investors. As we have cited before, economic factors support our view that inflation is not headed back to the Fed’s 2% target pace of inflation soon. As such, we can anticipate that the Fed will continue to raise benchmark policy interest rates another 100 to 125 basis points.
- For fixed income investors, higher policy rates and elevated inflation will lead to a reassessment of market interest rates, and their longer-run path will influence the returns on cash, bonds, and equities. Quite unlike the persistently low inflation period from 2002-2019, what role will real estate and gold play in an environment of higher inflation?
- We have cited three structural changes in the economy that raise inflation’s risk profile. First, deglobalization of trade shifts production to the home markets which, in the short run, incurs a higher cost of goods sold. Second, the labor shortage persists due to the declining labor force participation of older workers. For a given pace of demand, fewer workers would tend to lead to upward pressures on labor costs and prices. Finally, there is a geopolitical fragmentation that puts a higher floor on inflation rates of traded goods. This has been particularly true in Europe with its struggle to source the energy for continued industrial production. This fragmentation has directly triggered a breakdown in global energy markets, particularly for oil and natural gas.
- Another issue for fixed income investors is the recent passage of another federal spending bill that will raise the budget deficit profile in the years to come.
- Debt fundamentals (slower economic growth, more taxpayer dollars, and higher interest rates) have deteriorated. Therefore, the debt burden will fall into a scenario of higher taxes, spending cuts, and likely an acquiescence by the Fed to buy more debt and thereby bias upward inflation’s trajectory. For investors, this is another reason to reevaluate longer-term financial market values.
- Our outlook is that the Fed’s pursuit of inflation stability will bias interest rates upward and slow economic growth. Meanwhile, the Fed, Bank of Canada, the Bank of England, and the European Central Bank will continue to raise benchmark policy rates at least another 100 basis points which implies further increases in the U.S. Treasury benchmark 2-year, 5-year, and 10-year yields.
- In recent months, we have also witnessed a rise in unit labor costs for business in conjunction with a continuation of subpar economic growth. For equity investors, this is a hit on both the top line of revenue and the bottom line on costs. The outlook for corporate profits has therefore deteriorated with some analysts forecasting an outright decline in pre-tax profits in the year ahead.
- While economic growth has slowed in the U.S., the strength of the dollar continues as global investors see a flight to safety channel for their investments.
- Our outlook remains for modest, but subpar, economic growth with the acknowledged risk of recession given the Fed’s heightened pursuit of slowing inflation. Interest rates are likely to rise with Fed actions.
- Meanwhile, slower economic growth and higher interest rates translate into lower profit growth in 2023 relative to both 2022 and 2021 and thereby a tougher investment horizon for equities and corporate debt.
Quote of the Month
“The intelligent investor is a realist who sells to optimists and buys from pessimists.”
Benjamin Graham, American Economist, Investor, and Author
Chart of the Month
The information published herein is provided for informational purposes only, and does not constitute an offer, solicitation or recommendation to sell or an offer to buy securities, investment products or investment advisory services. All information, views, opinions and estimates are subject to change or correction without notice. Nothing contained herein constitutes financial, legal, tax, or other advice. The appropriateness of an investment or strategy will depend on an investor’s circumstances and objectives. These opinions may not fit to your financial status, risk and return preferences. Investment recommendations may change, and readers are urged to check with their investment advisors before making any investment decisions. Information provided is based on public information, by sources believed to be reliable but we cannot attest to its accuracy. Estimates of future performance are based on assumptions that may not be realized. Past performance is not necessarily indicative of future returns. The following indexes were used as proxies in the performance tables: Global Stocks = MSCI ACWI; U.S. Large Cap = S&P 500; U.S. Large Value = Russell 1000 Value; U.S. Large Growth = Russell 1000 Growth; U.S. Small Cap = Russell 2000; Int’l Dev Stocks = MSCI EAFE; Emerging Markets = MSCI EM; U.S. Inv Grade Bonds = Barclays U.S. Aggregate; U.S. High Yield Bonds = Barclays Corporate High Yield; Emerging Markets Debt = JPMorgan EMBI Global Diversified; Int’l Bonds = Barclays Global Treasury ex US; Cash = 3month T-Bill; Sector returns displayed in the chart represent S&P 500 sectors, while treasury benchmarks are from Barclays
Source: Schwab Center for Financial Research with data provided by Morningstar, Inc., as of 3/31/2022. Asset class performance represented by annual total returns for the following indexes: S&P 500® Index (US Lg Cap), Russell 2000® Index (US Sm Cap), MSCI EAFE® Net of Taxes (Int’l Dev), MSCI Emerging Markets IndexSM (EM), MSCI US REIT Index (REITs), S&P GSCI® (Comm.), Bloomberg Barclays U.S. Treasury Inflation-Linked Bond Index (TIPS), Bloomberg Barclays U.S. Aggregate Bond Index (Core US Bonds), Bloomberg Barclays U.S. High Yield Bond Index (High Yield Bonds), Bloomberg Barclays Global Aggregate Ex-USD TR Index (Int’l Dev Bonds), Bloomberg Barclays Emerging Markets USD Bond TR Index (EM Bonds), FTSE U.S. 3-Month T-Bill Index (T-Bills). Past results are not an indication or guarantee of future performance. Returns assume reinvestment of dividends, interest, and capital gains. Indexes are unmanaged, do not incur fees or expenses, and cannot be invested in directly.
Chart of the Month: The Leuthold Group
Chart of the Month
Quote of the Month
“The intelligent investor is a realist who sells to optimists and buys from pessimists.”
Benjamin Graham, American Economist, Investor, and Author
Trailing Returns