Market Perspectives October 2020
Capital Markets
By: Wade Austin
Riding a red-hot streak of five consecutive monthly gains, stocks finally cooled in September. All major global equity market indexes declined modestly, while fixed income markets were mostly flat. The S&P 500 dropped -3.8% but still began the 4th quarter up +5.6% YTD total return. The U.S. aggregate bond index was off -0.1%.
Notably, bond yields held steady as stocks corrected. If markets were reassessing the trajectory of economic growth, we’d expect yields to have dipped. As a result, September’s pullback (more severe among technology stocks) was more likely a healthy correction – in reaction to lofty valuations in over-bought sectors – than warnings of a more sinister outlook.
The Federal Reserve continues to reinforce its pledge to keep short-term interest rates near zero until both inflation is running above 2.0% and the unemployment rate returns to around 4.0%; conditions not expected to be met for several years. By signaling rates will remain low that far in advance, Fed monetary policy is clearly promoting investor risk-taking at the expense of saving.
September also marked the first month during the pandemic that value stocks (-2.5%) beat their growth counterparts (-4.7%). Industrials and Materials are two cyclical sectors enjoying impressive trends recently. As expressed in prior editions, we expect value stocks’ relative performance to consistently improve as the economic recovery proves more durable. Growth stocks tend to outperform when growth is scarce, as investors are willing to pay a premium for those distinctive companies with robust revenue increases (e.g., Amazon, Apple, Tesla, etc.). As our economist John Silvia advises, above trend GDP growth will be more challenging after Q3’s sharp rebound. Look for rising Treasury yields as a signal the recovery is gaining solid momentum.
The markets continue to be influenced by three key drivers: containment and cure of the coronavirus, the impending election, and an accommodative Fed. Currently, stocks appear relatively expensive. But given these historically low interest rates and bond yields, they look more attractive on a relative basis than cash and government bonds. Dividends of the S&P 500 stock index (1.79%), EAFE International index (2.9%), and EM index (2.1%) all yield more than U.S. 10-year Treasuries (0.69%).
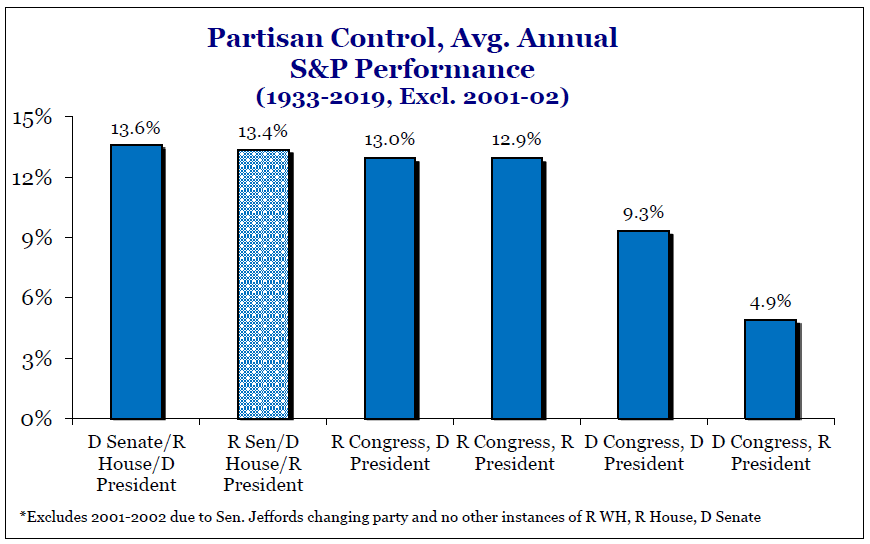
With elevated political tensions and uncertainty as the election draws near, increased volatility is to be expected. Among many impactful policies riding on the outcome, investors are most focused on tax policies. Regardless of the outcome, we would like to remind clients to remain focused on your long-term investment strategy. As our Chart of the Month depicts, the market is not partisan.
Insights by John Silvia, Director of Economics

Economic recovery continues with gains in employment in many sectors, and the unemployment rates continue to decline across all four ethnic groups and all four educational groups measured by the federal government. So where is the problem?
- Service sector unemployment rates are the highest and double that of management workers. Meanwhile, workers with less than a high school education have an unemployment rate double that of college graduates. The challenge for the economy is the structural unemployment of service workers – and this reflects the shutdowns, particularly in urban areas.
- Meanwhile, household wealth in the U.S. hit an all-time high in the latest quarter as home equity values and equity prices continue to rise. The housing market is extraordinarily strong with home prices up 5 percent over a year ago.
- The outlook for positive economic growth continues to be supported by the basic leading indicators we follow (claims, building permits, factory orders and consumer sentiment).
- However, there is no going back to normal. First, job gains will take several years to get back to the levels before the shutdowns. Our view, that the recovery will not be V-shaped, continues to pan out. Restructuring the service sector will continue, while the implementation of technology in communications, information processing and security will advance.
Each recession brings change, and as investors, we must recognize the changes and adapt our portfolio to those changes. Travel and leisure sectors will take some time to find a new style of delivering consumer value. The application of technology for secure communication, both electronically and visually, will be paramount. Online shopping will gain market share. Finally, healthcare will be a sustained, not short-run, winner. These themes remain a core of the economic outlook and has been central to economic progress since April.
Quote of the Month
“The most important quality for an investor is temperament, not intellect.”
Warren Buffett – Chairman, Berkshire Hathaway
Chart of the Month
The information published herein is provided for informational purposes only, and does not constitute an offer, solicitation or recommendation to sell or an offer to buy securities, investment products or investment advisory services. All information, views, opinions and estimates are subject to change or correction without notice. Nothing contained herein constitutes financial, legal, tax, or other advice. The appropriateness of an investment or strategy will depend on an investor’s circumstances and objectives. These opinions may not fit to your financial status, risk and return preferences. Investment recommendations may change, and readers are urged to check with their investment advisors before making any investment decisions. Information provided is based on public information, by sources believed to be reliable but we cannot attest to its accuracy. Estimates of future performance are based on assumptions that may not be realized. Past performance is not necessarily indicative of future returns. The following indexes were used as proxies in the performance tables: Global Stocks = MSCI ACWI; U.S. Large Cap = S&P 500; U.S. Large Value = Russell 1000 Value; U.S. Large Growth = Russell 1000 Growth; U.S. Small Cap = Russell 2000; Int’l Dev Stocks = MSCI EAFE; Emerging Markets = MSCI EM; U.S. Inv Grade Bonds = Barclays U.S. Aggregate; U.S. High Yield Bonds = Barclays Corporate High Yield; Emerging Markets Debt = JPMorgan EMBI Global Diversified; Int’l Bonds = Barclays Global Treasury ex US; Cash = 3month T-Bill; Sector returns displayed in the chart represent S&P 500 sectors, while treasury benchmarks are from Barclays
Sources: Strategas
Chart of the Month
Quote of the Month
“The most important quality for an investor is temperament, not intellect.”
Warren Buffett – Chairman, Berkshire Hathaway