Market Perspectives November 2022
Capital Markets
By: Wade Austin
On the heels of one of the worst Septembers on record, U.S. stocks surged in October and posted their best month since 1976. Stocks became oversold and cheap as a doom and gloom sentiment permeated markets the prior month and a half. With recession fears intensifying, markets (perhaps counterintuitively) shifted to a risk-on mode based primarily on speculation that the Fed would slow the pace of rate hikes after November’s 4th consecutive 75 bps hike.
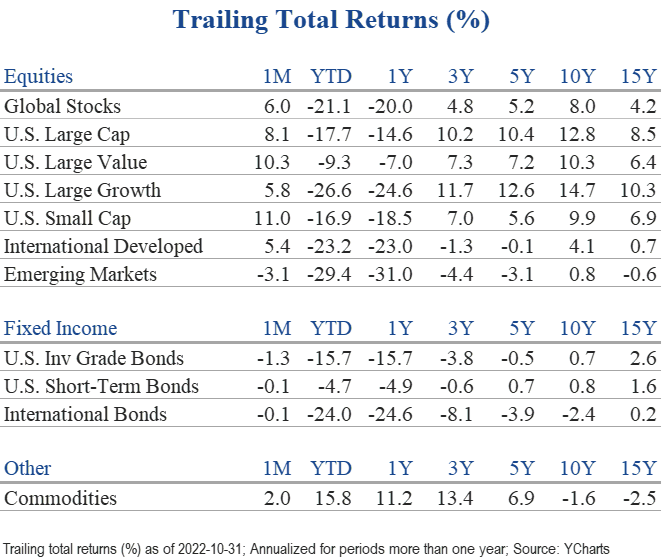
In October, the Dow Jones Industrial Average rose 14%, while the S&P 500 large-cap index and the Russell 2000 small-cap index posted stellar 8.1% and 11.0% gains, respectively. Value stocks (+10.3%) continued to outperform growth (+5.8%) and hold a 17-point advantage this year. Bear markets often serve as a catalyst for changes in market leadership based on extended imbalances in stock market fundamentals. The rotation away from the fastest growing, high P/E stocks to quality factors such as higher dividend paying stocks has been driven, in part, by investors seeking to cushion downside exposure while still expecting to participate in an eventual recovery.
During last month’s rally, all eleven S&P 500 sectors advanced, led by energy’s 25% spike. The communications services sector lagged and was barely positive (+0.1%). Its two largest constituents, Meta Platforms (Facebook) and Alphabet (Google) reported disappointing quarterly results and forward guidance. The diverging performance of these two sectors has been unusually extreme and emblematic of the year-long value vs. growth story. On a YTD basis through October, energy was up 68%. Communications services dropped 39%.
Hopes that central banks worldwide would also reevaluate monetary policy contributed to a monthly 5.4% gain in developed international stocks. However, emerging market stocks continued their struggles (-3.1%) mainly due to heavy selling pressure in Chinese stocks. Despite more attractive valuations relative to historical averages, international and emerging market stocks continue to lag the S&P 500. A surging U.S. dollar has amplified the negative returns of foreign equities, but the pendulum will swing in the other direction at some point.
Against the backdrop of stubbornly high inflation and aggressive rate hikes, U.S Treasury yields continued their march higher, and bonds delivered another monthly loss. The yield on the 10-year Treasury rose 22 bps to 4.05%, which is 194 bps higher than its 10-year average of 2.11%. The Bloomberg U.S. Aggregate Bond Index declined 1.3% in October and a shockingly painful 15.7% YTD. Given their positive correlation to stocks, high-yield corporate bonds gained 2.6%, leading all bond sectors as their default rate stood at 2.3% (almost half its long-term average).
Fed Chairman Jerome Powell dashed hopes for a near-term interest rate pivot after explicitly signaled ‘higher rates for longer’ last Wednesday. Bond yields rose, and the stock market gave back some of October’s gains in a dramatic intraday reversal. With the path of inflation expected to remain the primary determinant for the direction of interest rates and markets going forward, this year’s heightened market volatility should moderate with indications of peaking inflation over the coming months. However, it is difficult to expect the market to take off given economic growth will likely decelerate into 2023.
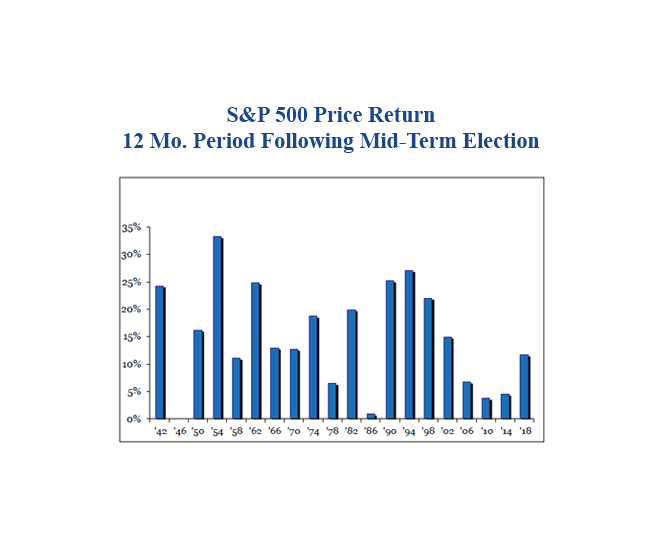
The midterm elections may be a cause for modest optimism and staying invested. Our Chart of the Month reveals that stocks have not declined in the 12 months following midterms since 1942. The persistent inflation and rising rate environment continue to be a challenge, but eliminating uncertainty regarding the next two year’s economic policies has been an important catalyst. U.S. corporate management teams have proven effective navigators in most environments – if they know Washington’s rules and regulations.
Depending on the election results, certain companies and sectors will be poised to benefit. If Democrats maintain complete control of Congress, they are expected to push the remaining parts of their spending agenda, such as Medicaid expansion, clean energy tax credits, and additional federal funding for states. HMOs, hospital corporations, clean energy companies, utilities, and municipal bonds would all be beneficiaries.
If the Republicans win the House, Senate, or both, gridlock will return to Washington. Markets will view limits on additional federal spending as less inflationary. Corporate, individual, and capital gains tax increases should be off the table, thus boosting stocks generally. Energy, defense, pharma, and biotech are specific sectors expected to benefit from lessened regulatory fears.
Insights by John Silvia, Director of Economics

‘Higher for longer’ is the theme for interest rates going forward based upon persistent inflation and recent Federal Reserve policy actions. For investors, this means a higher discount factor for future earnings. As a benchmark, we cite the two-year Treasury rate at 4.6% today.
- U.S. financial markets continue to adjust to the economic reality of moderate growth but lower profit expectations for the year ahead. Persistent inflation (thereby higher cost pressures on business and reduced real income for households) is one issue. In addition, higher policy-determined interest rates driven by the Fed’s pursuit of lower inflation going forward will limit the pace of economic growth.
- As an outlook, we retain our focus on a 3- to 5-year time horizon given that such difficult periods eventually give way to better economic and financial times. However, this focus does include the expectation that interest rates will be higher for longer during this period.
- Our investment focus on the future reflects our experience that U.S. economic growth should return to trend growth of 2.0 – 2.5 % and that the Fed is addressing the inflation problem rather than assuming it away. This is a core belief in our strategy.
- Core consumer price inflation is 4.2% over the last three months and 5.1% compared to a year ago. Therefore, inflation remains the number one challenge to investors. Economic factors support our view that inflation is not headed back to the Fed’s 2% target pace of inflation any time soon. As such, we can anticipate that the Fed will continue to raise benchmark policy interest rates by another 75 to 100 basis points over the next three months.
- For fixed-income investors, the ‘higher for longer’ theme amplifies the case for a reassessment of market interest rate expectations and how the long-run path of inflation and rates will influence the returns on cash, bonds, and equities. Higher long-term sovereign and corporate bond rates have selectively made fixed- income instruments more competitive on yield with equities.
- Real estate, at the national level, showed a disappointing third quarter, according to the latest Federal government reports. Both residential and nonresidential investments declined in the third quarter and have declined over the past year.
- Within the construction sector, gains in residential are evident in the apartment and home improvement spending. Both areas reflect the impact of higher mortgage rates on buying a home and construction supply costs.
- For the nonresidential construction sector, gains are in commercial and factory construction which are both up over the last six months.
- Energy and food commodities continue to show areas of investor interest. Year-to-date, futures prices are up for oil, natural gas, and wheat. Meanwhile, producer prices for total final demand goods, measured by the U.S. Bureau of Labor Statistics, are up 8.5% over a year ago.
- Why expect a higher inflation pace going forward? Last week’s employment report signaled continued wage pressures as average hourly earnings rose to 4.7 % year-over-year. The labor shortage and rising labor costs continue to put a squeeze on corporate profits for firms unable to pass on cost increases in a competitive market.
- For international investors, sovereign debt fundamentals have deteriorated (slower economic growth and higher interest rates) in many countries, especially emerging markets. The burden of this debt will generate a scenario of higher taxes and spending cuts in many nations, leading to slower economic growth.
- While economic growth has slowed in the U.S., the dollar’s strength continues as global investors see a flight to a safety channel for their investments.
- In general, our outlook is that the Fed’s pursuit of inflation stability will bias interest rates upward and slow economic growth. Meanwhile, the Fed, Bank of Canada, the Bank of England, and the European Central Bank will continue to raise benchmark policy rates at least another 100 basis points, which implies further increases in the U.S. Treasury benchmark 2-year, 5-year, and 10-year interest rates.
Quote of the Month
“Bad companies are destroyed by crisis. Good companies survive them. Great companies are improved by them.”
Andy Grove, Co-founder and former CEO of Intel Corp.
Chart of the Month
The information published herein is provided for informational purposes only, and does not constitute an offer, solicitation or recommendation to sell or an offer to buy securities, investment products or investment advisory services. All information, views, opinions and estimates are subject to change or correction without notice. Nothing contained herein constitutes financial, legal, tax, or other advice. The appropriateness of an investment or strategy will depend on an investor’s circumstances and objectives. These opinions may not fit to your financial status, risk and return preferences. Investment recommendations may change, and readers are urged to check with their investment advisors before making any investment decisions. Information provided is based on public information, by sources believed to be reliable but we cannot attest to its accuracy. Estimates of future performance are based on assumptions that may not be realized. Past performance is not necessarily indicative of future returns. The following indexes were used as proxies in the performance tables: Global Stocks = MSCI ACWI; U.S. Large Cap = S&P 500; U.S. Large Value = Russell 1000 Value; U.S. Large Growth = Russell 1000 Growth; U.S. Small Cap = Russell 2000; Int’l Dev Stocks = MSCI EAFE; Emerging Markets = MSCI EM; U.S. Inv Grade Bonds = Barclays U.S. Aggregate; U.S. High Yield Bonds = Barclays Corporate High Yield; Emerging Markets Debt = JPMorgan EMBI Global Diversified; Int’l Bonds = Barclays Global Treasury ex US; Cash = 3month T-Bill; Sector returns displayed in the chart represent S&P 500 sectors, while treasury benchmarks are from Barclays
Source: Schwab Center for Financial Research with data provided by Morningstar, Inc., as of 3/31/2022. Asset class performance represented by annual total returns for the following indexes: S&P 500® Index (US Lg Cap), Russell 2000® Index (US Sm Cap), MSCI EAFE® Net of Taxes (Int’l Dev), MSCI Emerging Markets IndexSM (EM), MSCI US REIT Index (REITs), S&P GSCI® (Comm.), Bloomberg Barclays U.S. Treasury Inflation-Linked Bond Index (TIPS), Bloomberg Barclays U.S. Aggregate Bond Index (Core US Bonds), Bloomberg Barclays U.S. High Yield Bond Index (High Yield Bonds), Bloomberg Barclays Global Aggregate Ex-USD TR Index (Int’l Dev Bonds), Bloomberg Barclays Emerging Markets USD Bond TR Index (EM Bonds), FTSE U.S. 3-Month T-Bill Index (T-Bills). Past results are not an indication or guarantee of future performance. Returns assume reinvestment of dividends, interest, and capital gains. Indexes are unmanaged, do not incur fees or expenses, and cannot be invested in directly.
Chart of the Month: Strategas
Chart of the Month
Quote of the Month
“Bad companies are destroyed by crisis. Good companies survive them. Great companies are improved by them.”
Andy Grove, Co-founder and former CEO of Intel Corp.
Trailing Returns