Market Perspectives November 2020
Capital Markets
By: Wade Austin
In October, uncertainties and drama associated with the election, pandemic, and fiscal stimulus negotiations weighed on markets. The S&P 500 closed October with its worst week since March and its second -8% drawdown since the prior all-time high on September 2nd. Despite the volatility, the S&P 500 was down only -2.7% for the month yet still up 2.8% YTD.
More notably, underlying trends within the global stock market, which we noted last month, continued to shift. Market breadth is improving. Small-cap, Mid-cap, and Emerging Market stocks outperformed U.S. Large-caps and Value beat Growth.
Overshadowed by the three dominant headlines referenced above, corporate earnings, PMI readings (measure of economic growth), and the labor market quietly posted impressive gains. During Q3 earnings season to date, 86% of companies beat their estimates compared to the recent historical average of 64%, and the average “surprise factor” has been +20% vs. the historical +3.4% average. PMIs are bouncing back to robust readings of expansion, and October’s 6.9% unemployment rate is recovering from its April 14.7% peak faster than expected.
Fixed Income markets have been paying attention to these readings. The 10-Year U.S. Treasury note closed October yielding 0.88%, up 19 basis points from September 30th. The B.B. U.S. Bond Aggregate index posted a -0.45% monthly return. Despite the pressure on stocks, credit markets remained stable with high yield credit spreads falling to pandemic lows. Meanwhile, the U.S. 2-Yr./10-Yr. yield curve is its steepest since 2018. The bond market is clearly signaling an expectation for growth and rising inflation, which would pressure the total returns of longer duration bonds.
With the most likely election outcome being a divided government (President Biden (D), a Democrat majority House, and a narrow Republican majority Senate), equity markets rallied finishing election week up +7.4% – its best week since April. During the Fall, markets had mostly priced in a Democrat sweep and were relieved that a divided government would likely not pass Biden’s full tax proposal. On Monday (11/9), stocks surged again with the Pfizer vaccine announcement. Flu vaccinations are 50% effective, so a 90% effective Covid vaccine developed in less than a year would be a truly remarkable achievement. Value stocks (relative to Growth stocks) experienced their best day in 25 years due to accelerated demand if economies fully reopen sooner.
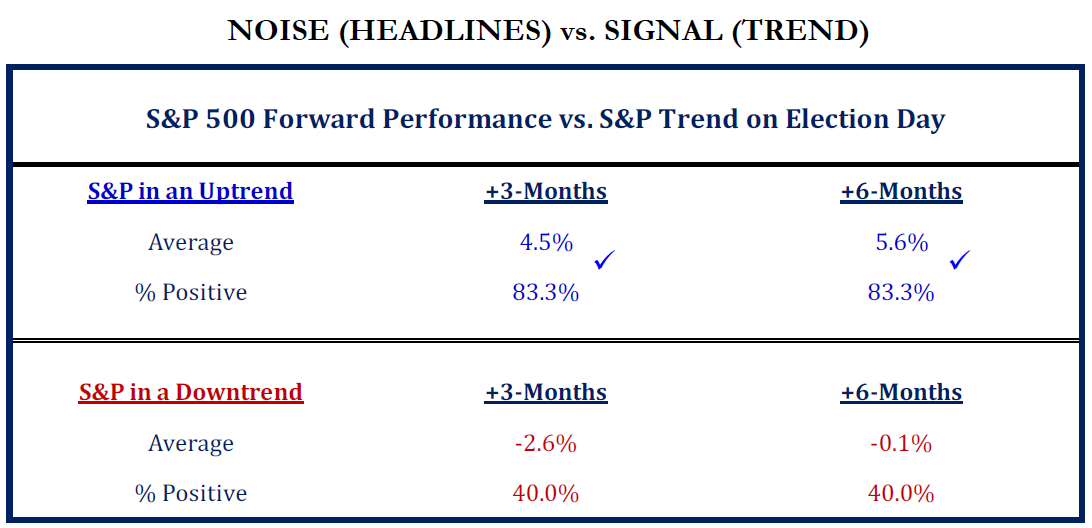
This year, investor patience and resolve has been rewarded in the face of serious challenges and noisy headlines. With markets entering the post-election period with strong momentum and bullish seasonality, our Chart of the Month suggests maintaining your commitment to your long-term plan is prudent, and we caution investors against thinking too short-term and not owning enough equities in preserving their wealth.
Insights by John Silvia, Director of Economics

Leading indicators and financial market prices continue to support the outlook for economic recovery. Now with the added benefit of a possible vaccine in use in a few months, the positive case for the economy and equity markets is strengthened. The basic leading indicators we follow (claims, building permits, factory orders and consumer sentiment) support the case for growth.
- The most recent employment report of over 900,000 private sector jobs and a drop in the unemployment rate below 7 percent provides support for consumer spending—the largest segment of overall economic growth.
- This consumer engine is further supported by the gains in household wealth in the U.S. which hit an all-time high in the latest quarter as equity values and home prices continue to rise. The housing market is extraordinarily strong with home prices up 5.7 percent over a year ago.
- Structural challenges still face certain segments of the economy that deal with large groups of customers who are unfamiliar with each other—hotels, cruise lines, and entertainment venues such as amusement parks and movie theaters.
- Moreover, consumer and business preferences have changed so that the challenge of determining scale for many businesses remains ahead.
Investors have been rewarded by following the fundamentals and taking a longer view of their position. Recessions are part of the economic cycle, but recovery and expansion are longer lasting. For each expansion, the economy moves ahead to a higher standard of living.
Three investor issues have recently come to the fore as the economic recovery has gained some ground, which we will monitor going forward.
- There is the assessment of the balance of financial leverage against the expected pace of economic growth.
- There is the increasing importance of non-bank finance in the economy and its characteristic of less oversight than the banking industry.
- There is the reality of declining potential growth estimates and a rising deficit to GDP estimate by the Congressional Budget office.
Quote of the Month
“Diversification is the one free lunch of investing, and when you see a free lunch, the only rational thing to do is eat.”
Cliff Asness – Managing Principal & CIO, AQR Capital Management
Chart of the Month
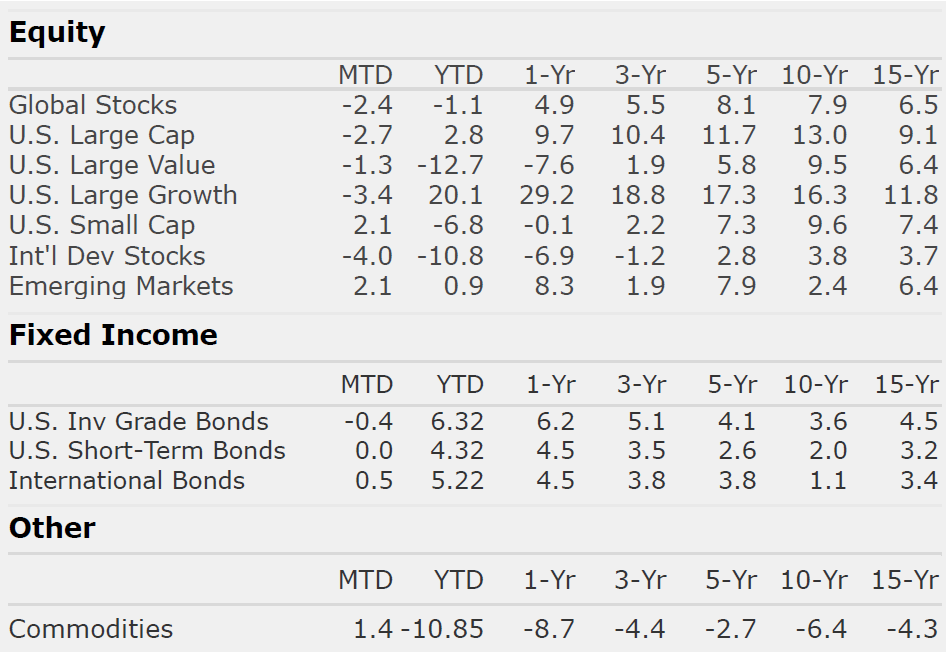
The information published herein is provided for informational purposes only, and does not constitute an offer, solicitation or recommendation to sell or an offer to buy securities, investment products or investment advisory services. All information, views, opinions and estimates are subject to change or correction without notice. Nothing contained herein constitutes financial, legal, tax, or other advice. The appropriateness of an investment or strategy will depend on an investor’s circumstances and objectives. These opinions may not fit to your financial status, risk and return preferences. Investment recommendations may change, and readers are urged to check with their investment advisors before making any investment decisions. Information provided is based on public information, by sources believed to be reliable but we cannot attest to its accuracy. Estimates of future performance are based on assumptions that may not be realized. Past performance is not necessarily indicative of future returns. The following indexes were used as proxies in the performance tables: Global Stocks = MSCI ACWI; U.S. Large Cap = S&P 500; U.S. Large Value = Russell 1000 Value; U.S. Large Growth = Russell 1000 Growth; U.S. Small Cap = Russell 2000; Int’l Dev Stocks = MSCI EAFE; Emerging Markets = MSCI EM; U.S. Inv Grade Bonds = Barclays U.S. Aggregate; U.S. High Yield Bonds = Barclays Corporate High Yield; Emerging Markets Debt = JPMorgan EMBI Global Diversified; Int’l Bonds = Barclays Global Treasury ex US; Cash = 3month T-Bill; Sector returns displayed in the chart represent S&P 500 sectors, while treasury benchmarks are from Barclays
Sources: Strategas
Chart of the Month
Quote of the Month
“Diversification is the one free lunch of investing, and when you see a free lunch, the only rational thing to do is eat.”
Cliff Asness – Managing Principal & CIO, AQR Capital Management
Trailing Returns