Market Perspectives March 2022
Capital Markets
By: Wade Austin
Russia’s invasion of Ukraine ignited turbulence across global markets as stocks and bonds broadly declined in February. Investors were mostly preoccupied with soaring inflation data and Federal Reserve rate hike expectations until Putin’s attack took center stage and sparked a geopolitical and humanitarian crisis. We are all saddened at the horrific impact on innocent lives.
The selling of risk assets that preceded the invasion intensified while traditional safe-haven assets such as the U.S. dollar, Treasuries, and gold outperformed. The S&P 500 dropped 3% in February despite generally strong Q4 corporate earnings reports. The benchmark U.S. large-cap index declined 8% YTD marking the 5th worst start since 1950. It briefly entered correction territory before concluding the month 8.8% below its most recent all-time high reached on 1/3/2022. Of the 11 major equity sectors, only Energy posted gains for the month, rising 7.1%. Energy gained 27.6% YTD on the heels of a stellar 2021 – its best year in four decades. Communications (-6.9%) was February’s laggard, while Consumer Discretionary (-13.3%) was the worst performer YTD.
International developed market stocks slightly outperformed U.S. stocks in February, but nascent recession fears in Europe resulting from sanctions on Russia are a concern. With fewer foreign revenue streams, U.S. small-cap stocks rebounded 1.1% in February but remained sharply negative YTD (-8.7%).
For the first time in 13 years, bonds failed to rally during an equity selloff. The 10-year Treasury note closed the month at 1.83% after cresting 2.0% in mid-February (the first time since 2019). The 2-year Treasury yield rose more aggressively (25 bps) to 1.43% raising growth concerns from the flattening yield curve.
Even with the late-month flight to safety, the Bloomberg U.S. Aggregate Bond Index declined 1.1% in February and 3.2% YTD. Fixed income sectors across the board weakened including investment-grade corporate bonds (-2.0%), high-yield bonds (-1.0%), and municipal bonds (-0.4%). With inflation jumping more than expected to 7.5%, U.S. TIPS were the lone exception, gaining 0.9%.
Commodities prices were already surging from increasing inflation pressures, then Russian-linked commodities popped after the invasion. The price of a barrel of oil was in the $80s in January and spiked above $130 days ago. Russia exports an impactful share of the world’s supply of eight commodities: palladium, natural gas, oil, wheat, nickel, fertilizer, aluminum, and steel. After posting an annualized return of (-2.6%) over the prior 15-year period (including 2021’s 27.1% gain!), the Bloomberg Commodities Index rose 6.2% in February and 15.6% YTD.
Commodities and the Energy sector appear overbought given their rapid increases. However, the changing geopolitical landscape may create more durable, structural impacts. It’s worth noting that the Energy sector’s percentage of the S&P 500 market cap is currently only 4%, off its low of 2% in 2020. Its all-time high is 27% and 50-year average is 11%. Meanwhile, Apple and Microsoft’s market cap are each larger than the entire Energy sector.
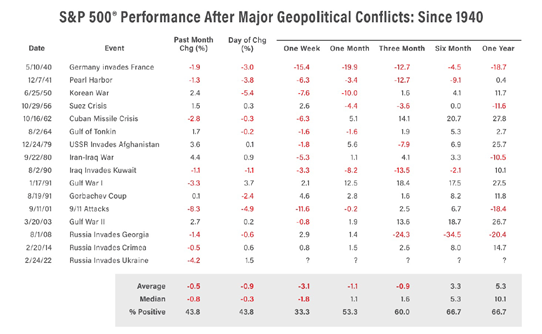
The widening range of potential outcomes to the crisis in Ukraine makes navigating the heightened volatility extremely difficult. As we don’t pretend to know how the conflict will play out, we caution against rash risk-on or risk-off moves. As our Chart of the Month details, the S&P 500’s 3, 6, and 12-month forward returns from the date of prior major geopolitical conflicts are mostly positive. Bearish investor sentiment has already reached extreme levels which can be interpreted as a signal for attractive entry points (see our Quote of the Month). Keeping a measured approach while staying invested in a diversified, balanced portfolio has historically helped disciplined, long-term investors keep on track during tumultuous times.
Insights by John Silvia, Director of Economics

For investors, the conflict between Russia and Ukraine will have pervasive impacts on economic growth (profits), inflation, interest rates, and the dollar exchange rates. Economic growth expectations will be lower as higher inflation will reduce real, personal income as well as lower consumer confidence. Slower Euro area growth is also in the cards.
- Higher inflation will imply persistent increases in the federal funds rate and benchmark 2-year, 5-year, and 10-year interest rates. Sanctions and the expectations for slower growth have raised the risk profile of both high-yield and AA corporate bonds as spreads have widened. Euro banking and Russian corporate defaults will also raise the investor’s risk profile.
- The U.S. dollar has risen in value as a haven for global investors. The dollar has also benefited from the liquidity payments issue for the Russian ruble.
- January’s U.S. employment report, despite the Russia-Ukraine crisis, strengthens the case for continued, above-trend economic growth and increases in the benchmark funds rate by the Federal Reserve. Slower economic growth (but still above target), inflation, and a Federal Reserve committed to reducing quantitative stimulus while also raising short-term interest rates will characterize the year 2022.
- The latest survey of manufacturing purchasing agents provides a good perspective. First, the overall index and both the production and orders components support the case for economic growth but at a slower pace in 2022 compared to last year. The employment component indicates further job gains and thereby personal income/spending growth. The order backlogs and supplier deliveries index intimates that supply chain issues remain.
- As for inflation, the manufacturing survey provides evidence for a reduction in input and commodity pressures, but the level of these pressures suggests rising prices—just at a slower pace than we witnessed in the second half of 2021. Core PCE inflation, the favored target of Fed policy, came in at 6.9% for the last three months as of December and 6.1% over a year ago. These numbers are significantly above the Fed’s target of 2%.
- For Fed policy, the persistence of price pressures has led the Federal Reserve to drop the transitory inflation story. They now expect sustained inflation going forward. This has accelerated the Fed’s outlook for tapering and raising the funds’ rate in 2022.
- As for profits, slower economic growth tends to be associated with slower profit growth, especially in an environment of rising interest rates. Core consumer inflation is a challenge to investors as real returns on cash and sovereign debt continue negative. With the Federal Reserve now committed to reducing their expansionary policy, the stage is set for additional volatility in financial asset prices as evidenced by NASDAQ and technology equity prices this year.
- Periods of accelerating and decelerating growth and inflation benchmarks can distract from the long-run goals of investors. Investment opportunities and risks change as the economic recovery evolves often due to changes in economic policy. Our view is that the economic outlook in 2022 and 2023 will not be a repeat of 2021 and will be more challenging for investors. Constant awareness of economic and political developments is necessary for thoughtful portfolio management.
Quote of the Month
“The time of maximum pessimism is the best time to buy, and the time of maximum optimism is the best time to sell.”
Sir John Templeton, Legendary American-British Investor
Chart of the Month
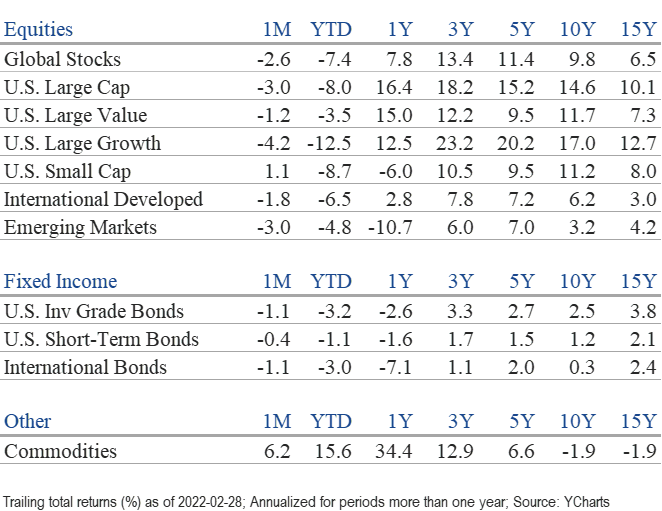
The information published herein is provided for informational purposes only, and does not constitute an offer, solicitation or recommendation to sell or an offer to buy securities, investment products or investment advisory services. All information, views, opinions and estimates are subject to change or correction without notice. Nothing contained herein constitutes financial, legal, tax, or other advice. The appropriateness of an investment or strategy will depend on an investor’s circumstances and objectives. These opinions may not fit to your financial status, risk and return preferences. Investment recommendations may change, and readers are urged to check with their investment advisors before making any investment decisions. Information provided is based on public information, by sources believed to be reliable but we cannot attest to its accuracy. Estimates of future performance are based on assumptions that may not be realized. Past performance is not necessarily indicative of future returns. The following indexes were used as proxies in the performance tables: Global Stocks = MSCI ACWI; U.S. Large Cap = S&P 500; U.S. Large Value = Russell 1000 Value; U.S. Large Growth = Russell 1000 Growth; U.S. Small Cap = Russell 2000; Int’l Dev Stocks = MSCI EAFE; Emerging Markets = MSCI EM; U.S. Inv Grade Bonds = Barclays U.S. Aggregate; U.S. High Yield Bonds = Barclays Corporate High Yield; Emerging Markets Debt = JPMorgan EMBI Global Diversified; Int’l Bonds = Barclays Global Treasury ex US; Cash = 3month T-Bill; Sector returns displayed in the chart represent S&P 500 sectors, while treasury benchmarks are from Barclays
Chart of the Month Source: AMG
Chart of the Month
Quote of the Month
“The time of maximum pessimism is the best time to buy, and the time of maximum optimism is the best time to sell.”
Sir John Templeton, Legendary American-British Investor
Trailing Returns