Market Perspectives – March 2020
Capital Markets
By: Wade Austin
After ending January with a minor 3% pullback upon the emergence of the coronavirus in China, the S&P 500 surged 5% to an all-time high of 3386 on February 19th, responding to better than expected corporate earnings and early signs of a global manufacturing recovery.
But news of the virus spreading outside of China’s borders to Italy was a turning point. The index plunged 12.8% in only 6 trading days – the fastest correction (-10% decline) from a peak on record. Oil, copper, and other industrial commodities tumbled. Meanwhile, safe haven assets, like treasury bonds and gold, rallied. U.S. 10Y Treasury yields fell from 1.52% to 1.13% in February and astonishingly fell below 1% in early March. Core U.S. bonds once again provided portfolios with valuable downside protection and ballast during this abrupt risk-off pivot.
Markets are now focused on the impact of the cure, clearly a fluid backdrop with plenty of unknowns. Unlike most economic shocks, COVID-19 is simultaneously affecting both supply (the flow of goods around the globe) and demand (the consumption as people join quarantines). As the virus becomes contained, likely more quickly in advanced economies like the U.S., expect more aggressive policy and stimulus measures globally to curtail the economic impact. The unexpected oil price war has jolted markets with new economic dislocations.
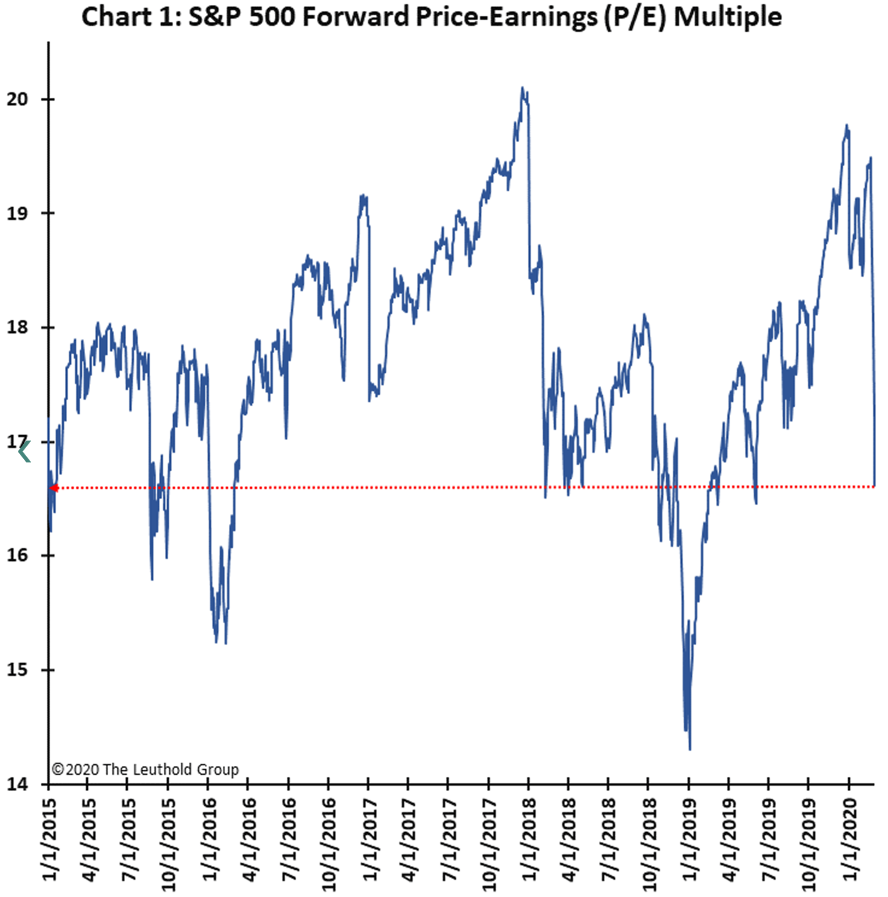
Historically, we’ve enjoyed strong rebounds from exogenous economic shocks, but bottoming is a process. V-shaped recoveries (i.e., Dec. 2018) are atypical. When markets experience a Bang, a Whimper often follows. During the 1998, 2011, and 2015/2016 corrections, the bang averaged 89% of the total decline. It took 80 days on average to reach news highs from the bottom. If the U.S. can avoid a recession, the silver lining for investors may be that the S&P 500 has been re-valued in record time, dropping from a Fwd. P/E of 19.8x to 16.6x.
Insights by John Silvia, Director of Economics

Recession Risks
The coronavirus outbreak has certainly raised the risk profile of our recession model since it is built on fundamental indicators (which include leading indicators such as the equity market, capital goods, Fed orders, and consumer confidence). At this point, we still estimate a less than one in three chance of a U.S. recession in the next three months. Portfolios weighted more toward Asian equities will be harder hit in the short-term and over time to the extent that supply chains are altered.
What will we Monitor?
To judge the limit of the extent of any economic/financial damage, we look at policy actions and the solid state of domestic business and household finance. We will watch for an easing of monetary policy by several central banks (i.e., the Fed’s 50 bps emergency cut last week) and some fiscal policy ease in the U.S. At the current time, household and nonfinancial corporate balance sheets have been in good shape (unlike 2006-2008). So, any damage to the economy should be limited.
An Advantage for the U.S. Economy
For the U.S., the housing and consumer spending pace will help offset any global negatives. The U.S. remains primarily a domestic focused economy, unlike those of Asia or Europe.
Quote of the Month
“It’s not the things you don’t know that get you in trouble, it’s the things you know for sure that just ain’t so.”
Mark Twain
Chart of the Month
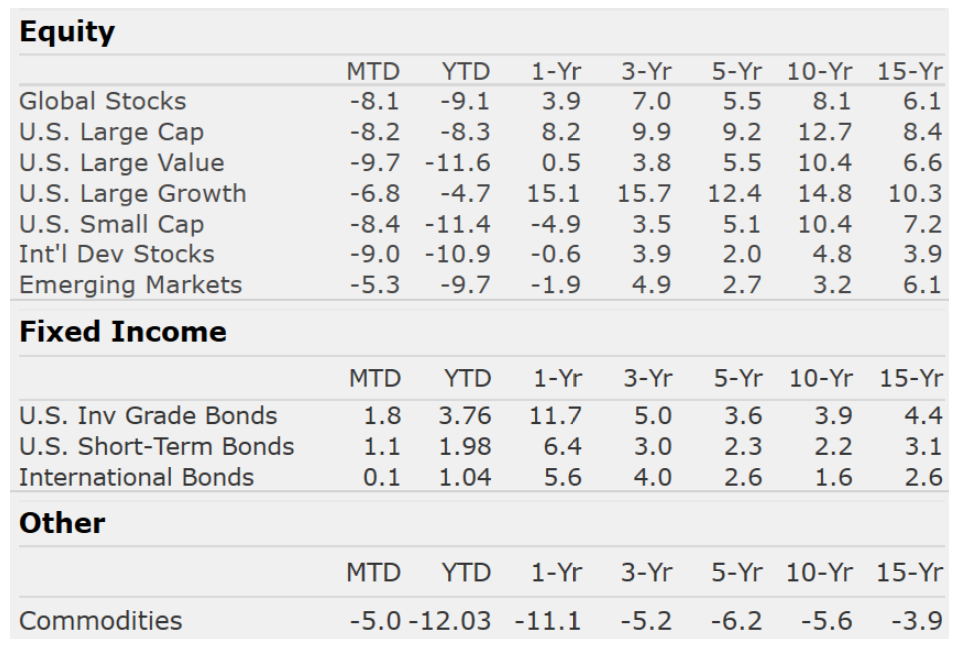
The information published herein is provided for informational purposes only, and does not constitute an offer, solicitation or recommendation to sell or an offer to buy securities, investment products or investment advisory services. All information, views, opinions and estimates are subject to change or correction without notice. Nothing contained herein constitutes financial, legal, tax, or other advice. The appropriateness of an investment or strategy will depend on an investor’s circumstances and objectives. These opinions may not fit to your financial status, risk and return preferences. Investment recommendations may change, and readers are urged to check with their investment advisors before making any investment decisions. Information provided is based on public information, by sources believed to be reliable but we cannot attest to its accuracy. Estimates of future performance are based on assumptions that may not be realized. Past performance is not necessarily indicative of future returns. The following indexes were used as proxies in the performance tables: Global Stocks = MSCI ACWI; U.S. Large Cap = S&P 500; U.S. Large Value = Russell 1000 Value; U.S. Large Growth = Russell 1000 Growth; U.S. Small Cap = Russell 2000; Int’l Dev Stocks = MSCI EAFE; Emerging Markets = MSCI EM; U.S. Inv Grade Bonds = Barclays U.S. Aggregate; U.S. High Yield Bonds = Barclays Corporate High Yield; Emerging Markets Debt = JPMorgan EMBI Global Diversified; Int’l Bonds = Barclays Global Treasury ex US; Cash = 3month T-Bill; Sector returns displayed in the chart represent S&P 500 sectors, while treasury benchmarks are from Barclays
Sources: CIC, Morningstar Direct, and The Leuthold Group
Chart of the Month
Quote of the Month
“It’s not the things you don’t know that get you in trouble, it’s the things you know for sure that just ain’t so.”
Mark Twain
Trailing Returns