Market Perspectives – March 2018
Capital Markets
The streak has ended! After 15 positive months the S&P 500, was down in February. The U.S. stock market fell from peak to trough more than 10% briefly but rallied the final two weeks of the month to end down -4.7%. International and emerging markets stocks were down more than 5% on the month. Meanwhile, very few asset classes posted positive returns as bonds fared poorly due to rising rates.
As a reminder of the unpredictability of markets, it was actually multiple pieces of good news that sparked the drop in stocks. Who would have thought after all this time of political uncertainty the one thing that would cause a correction was good economic data? A better than expected jobs number at the end of January, coupled with a higher than expected wage growth reading the following week sounded the inflation alarm bells. Bond yields responded by shooting higher (they have actually been going higher since the middle of December) and stocks fell.
It has been clear for some time that a strong and unexpected increase in inflation would do harm to financial assets. During this nearly 10 year-long economic recovery, inflation has remained persistently low. With inflation near zero, super low interest rates can be justified and risk assets such as stocks, high yield bonds, and real estate appreciate due to lower cost of capital and lower discount rates. A rapid jolt higher in rates is a risk to the stock market. However, not all stocks are equal. We have been arguing for some time that the most dangerous pockets of the market seemed to be the “bond proxies”. These are stocks and other risky assets that pay consistent income. In a world of low income, investors have happily piled into higher income securities despite the risks. As depicted below, REITs and Utilities have each fallen nearly 10% since rates started rising while bank stocks are up considerably (banks tend to do better in higher rate environments). While the repricing does make some of these securities more attractive we would still argue that many of these stocks and sectors look overpriced.
While some of the recent data has suggested higher inflation, I do not believe we will see runaway inflation. Interest rates and inflation will likely remain under control due to retiring workers. We will cover this topic more next month but ultimately believe the market fears of inflation are overblown.
1,000 points on the Dow isn’t what it used to be
Early in 2018, the stock market soared. Headlines on CNBC and Bloomberg proclaimed that the Dow was making its way from 25,000 to 26,000 and it was the fastest 1,000 point increase in history. Just a few weeks later, on February 9th the same news outlets argued that the 1,000 point drop in the Dow was the largest in history. Were we really seeing something extraordinary and unusual? No, not really. Using 1,000 point swings today and comparing them to 1,000 point swings in the past makes no sense. As the Dow increases in price, the impact of a 1,000 point swing drops dramatically in percentage terms.
Stepping back for a moment, the Dow experienced its worst one day drop in history on October 19, 1987 when it crashed 508 points in one day. Importantly, the day before the drop, the Dow was at 2,246 and the one day drop was a mind boggling 23% in just one trading day. Last month’s one day drop of over 1,000 points represented about 3.5%, quite a bit different than 23%! A few thoughts:
- It seems like just about every trading day we see a move in the Dow of more than 100 points these days. But it’s important to remember that a move of 200 points in the Dow is less than 1%.
- It’s quite common and should be expected to see the stock market move by +/- 1% in a day.
- A move of +/- 3% in a day is rare but does happen periodically. A 3% day in the Dow would be around an 800 point move.
- This concept doesn’t just apply to the Dow, it applies to all assets. As prices go higher it should be expected that there will be bigger price swings.
- As human beings, we tend to be attracted to narratives far more than facts or statistics. The headline that focuses on the point swing in the Dow tries to take advantage of our attraction to the narrative, rather than focusing on what is really happening. Remember, their job is to keep you watching and reading!
- While there is no way to fully avoid the feeling of dread when the markets fall apart, it’s always important to put the current events into context. In most cases, an event will be unique in its own right but will share similarities to historical events.
By: Dustin Barr, CFA
All data sourced from Morningstar Direct unless otherwise noted. The information published herein is provided for informational purposes only, and does not constitute an offer, solicitation or recommendation to sell or an offer to buy securities, investment products or investment advisory services. All information, views, opinions and estimates are subject to change or correction without notice. Nothing contained herein constitutes financial, legal, tax, or other advice. The appropriateness of an investment or strategy will depend on an investor’s circumstances and objectives. These opinions may not fit to your financial status, risk and return preferences. Investment recommendations may change and readers are urged to check with their investment advisors before making any investment decisions. Information provided is based on public information, by sources believed to be reliable but we cannot attest to its accuracy. Estimates of future performance are based on assumptions that may not be realized. Past performance is not necessarily indicative of future returns. The following indexes were used as proxies in the performance tables: Global Stocks = MSCI ACWI; U.S. Large Cap = S&P 500; U.S. Large Value = Russell 1000 Value; U.S. Large Growth = Russell 1000 Growth; U.S. Small Cap = Russell 2000; Int’l Dev Stocks = MSCI EAFE; Emerging Markets = MSCI EM; U.S. Inv Grade Bonds = Barclays U.S. Aggregate; U.S. High Yield Bonds = Barclays Corporate High Yield; Emerging Markets Debt = JPMorgan EMBI Global Diversified; Int’l Bonds = Barclays Global Treasury ex US; Cash = 3month T-Bill; Sector returns displayed in the chart represent S&P 500 sectors, while treasury benchmarks are from Barclays
Quote of the Month
“Low interest rates are usually attributed to low inflation, weak economic growth, and super easy monetary policy. But there’s another deep-seated factor that doesn’t get much attention: demographics.”
Greg ip – Wall Street Journal
Chart of the Month
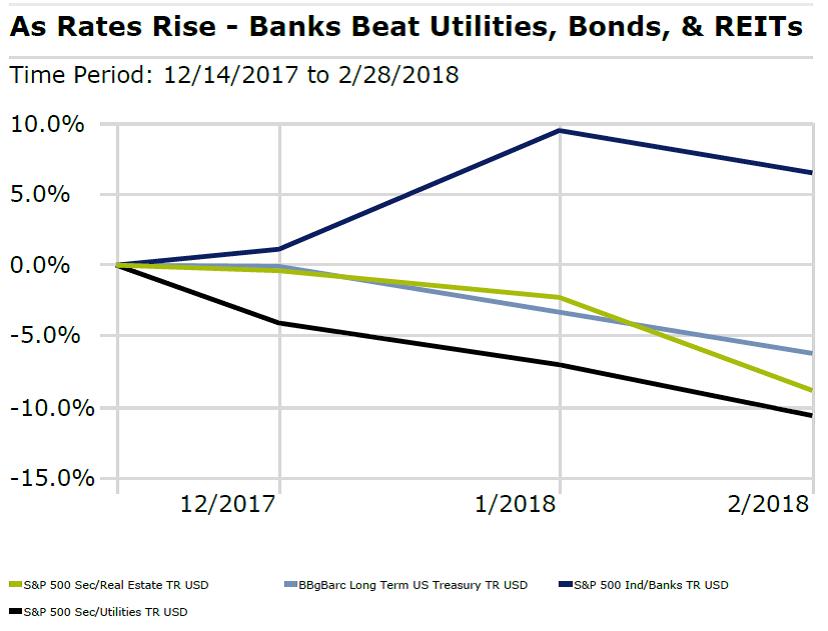
Chart of the Month
Quote of the Month
“Low interest rates are usually attributed to low inflation, weak economic growth, and super easy monetary policy. But there’s another deep-seated factor that doesn’t get much attention: demographics.”
Greg ip – Wall Street Journal
Trailing Returns