Market Perspectives – April 2018
Capital Markets
After fifteen consecutive months of gains, stocks were negative for a second month in a row and posted the first negative quarter since Q3 2015. In the U.S., small cap stocks were flat and slightly beat large cap stocks. Growth stocks beat value stocks, posting positive returns on the quarter. Outside the U.S., emerging markets saw positive returns as they were bolstered by a weaker U.S. dollar and by strong returns in Brazil and Russia. Meanwhile, developed countries outside of the US posted a -1.5% return on the quarter, led downward by weakness in Europe.
Both short- and long-term interest rates rose in the quarter as the Fed continued its withdrawal of monetary stimulus with another rate hike in March. Despite the higher rates, the yield curve (the difference between the interest rates of longer bonds and shorter bonds) has flattened significantly. The spread between the 10-year and 2-year bond is now at its lowest levels since before the financial crisis. If long-term rates do not increase for the remainder of 2018 and the Fed continues to raise rates, we may see the curve invert, meaning short-term bonds will pay higher interest rates than longer-term bonds. Typically, a steep yield curve is positive for economic growth and markets, and an inverted yield curve is negative for markets and the economy. If longer-term rates do not increase, the Fed may be forced to slow or halt its rate hikes.
New proposed tariffs announced from the White House also weighed on the stock market in March. Investors are likely trying to assess if more aggressive U.S. trade policies can be successfully negotiated without escalating into a full blown trade war with at least one of our closest trading partners. While we cannot predict the odds of a trade war, we do expect the process to intensify causing increased anxiety for investors and volatility in markets. The global economy is quite complex with most developed and large economies being highly dependent on each other. China is dependent on the U.S., and the U.S. is dependent on China. A full scale trade war would likely be highly destructive to the global economy and could lead to a major pullback in equity markets. While possible, we do not think it is likely.
In the near term, corporate earnings reports in April and May should give the market direction. With the new tax bill having gone into effect at the beginning of the year, the earnings reports will likely give markets a glimpse of how much stimulus has been put into the economy. Additionally, inflation readings will be important. As we have commented before, the markets are clearly in the late stage of the market cycle. Expected returns from here should be muted, but investors are still being paid to take risk. It seems likely that a healthy economy and recent fiscal stimulus will prolong this cycle, but at this late stage it is important not to take undue risk.
The S&P 500 is High Tech
The adjacent tables highlight the sector weights of the S&P 500 today vs. September 30, 2007 (end of the last bull). Much has been made about the success of index investing. It can make sense to incorporate index funds into portfolios as they provide a tax efficient, low cost way of gaining access to markets. There are some who refer to indexing as “low risk”. However, it is important to note that indexing, while efficient, is not inherently low risk. Indexing is simply a replication of the markets. The index fund should be expected to deliver returns that match the index minus the low fees. A few thoughts:
- Over a full market cycle, indexing typically performs well as markets tend to compensate investors for taking risk.
- In bull markets, like the one we have experienced over the last 10 years, indexing tends to do quite well against actively managed funds. There are a number of reasons for this, but one is momentum. Momentum tends to build steam in a bull market. Winners tend to continue to win (Amazon and Apple in this cycle) and losers tend to continue to lose (Banks and Energy in this cycle).
- An index fund’s holdings are weighted by the proportional market capitalization of each company in that index. Therefore, if the stock outperforms, the size of the company goes up. Thus, the company’s weight in the index increases. This momentum can be powerful in leading the markets higher.
- A significant risk of momentum investing is that when the tailwind stops, it is by its very nature at that point the index fund is comprised of a larger weighting in that company’s stock than ever before. Consequently, the drop in the price of the company’s stock does disproportionately large damage to the index fund’s returns.
- As the adjacent tables reflect, technology stocks and cylical stocks have had such a strong run that their weights in the S&P 500 index are 42% and 52% greater, respectively. Technology stocks now make up 22% of the weight of the index. Conversely, financial stocks were the highest weighted sector right before the financial crisis.
- Value investing is the opposite of momentum investing. Value investors subscribe to the theory of “reversion to the mean”. Typically, when momentum investing fails, value investing does great. Pairing value managers with indexes could give investors a good outcome over the full cycle without subjecting a portfolio to risks of major drawdowns or underperformance.
By: Dustin Barr, CFA
All data sourced from Morningstar Direct unless otherwise noted. The information published herein is provided for informational purposes only, and does not constitute an offer, solicitation or recommendation to sell or an offer to buy securities, investment products or investment advisory services. All information, views, opinions and estimates are subject to change or correction without notice. Nothing contained herein constitutes financial, legal, tax, or other advice. The appropriateness of an investment or strategy will depend on an investor’s circumstances and objectives. These opinions may not fit to your financial status, risk and return preferences. Investment recommendations may change and readers are urged to check with their investment advisors before making any investment decisions. Information provided is based on public information, by sources believed to be reliable but we cannot attest to its accuracy. Estimates of future performance are based on assumptions that may not be realized. Past performance is not necessarily indicative of future returns. The following indexes were used as proxies in the performance tables: Global Stocks = MSCI ACWI; U.S. Large Cap = S&P 500; U.S. Large Value = Russell 1000 Value; U.S. Large Growth = Russell 1000 Growth; U.S. Small Cap = Russell 2000; Int’l Dev Stocks = MSCI EAFE; Emerging Markets = MSCI EM; U.S. Inv Grade Bonds = Barclays U.S. Aggregate; U.S. High Yield Bonds = Barclays Corporate High Yield; Emerging Markets Debt = JPMorgan EMBI Global Diversified; Int’l Bonds = Barclays Global Treasury ex US; Cash = 3month T-Bill; Sector returns displayed in the chart represent S&P 500 sectors, while treasury benchmarks are from Barclays
Quote of the Month
“Look up at the stars and not down at your feet. Try to make sense of what you see, and wonder about what makes the universe exist. Be curious.”
Stephen Hawking
Chart of the Month
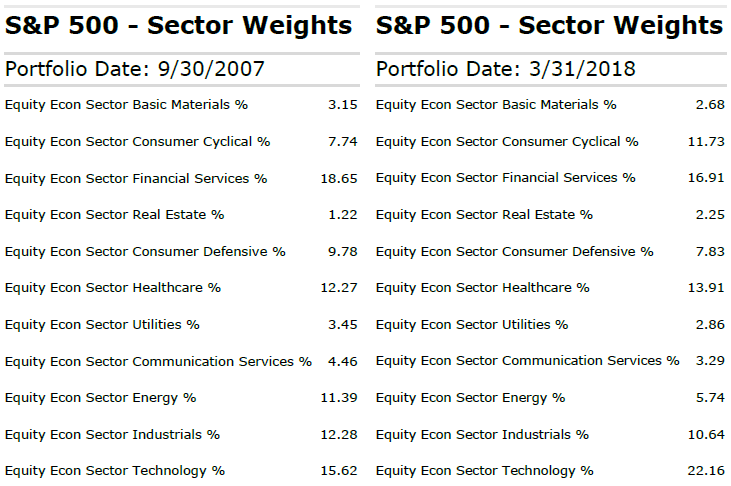
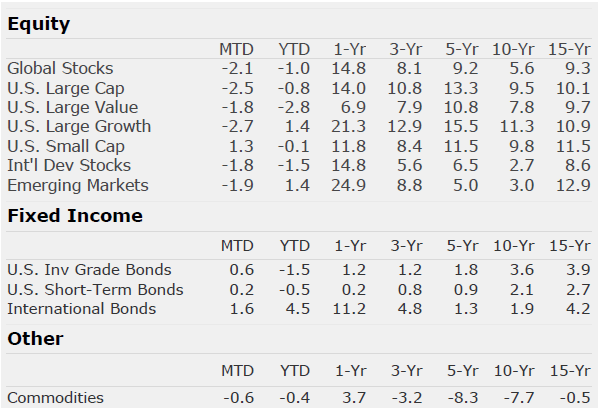
Chart of the Month
Quote of the Month
“Look up at the stars and not down at your feet. Try to make sense of what you see, and wonder about what makes the universe exist. Be curious.”
Stephen Hawking
Trailing Returns