Market Perspectives December 2021
Capital Markets
By: Wade Austin
The positive momentum for stocks that began in mid-October continued into Thanksgiving with the S&P 500 surging 9.4% QTD as Covid cases nationally declined. Respected health officials, including former FDA Commissioner Dr. Scott Gottlieb, suggested Covid might be under control by Spring. Unlike the prior year, entire families felt safe to gather around the Thanksgiving Day table to offer thanks, feeling life was on the verge of returning to normal.
Suddenly, the bright light at the end of the tunnel turned dark overnight. News broke of the fast-spreading new Covid variant in South Africa. Omicron fears sparked a broad market selloff on Black Friday as the S&P 500 and NASDAQ fell -2.2% and -3.5%, respectively. It was the worst Black Friday session on record for both indexes.
On November 30th, two trading days later, Fed Chairman Powell indicated during a Senate hearing that the Fed would likely accelerate tapering, opening the door to raising rates much sooner than the market was anticipating. Powell’s heightened inflation concerns sent stocks skidding another -2.0%.
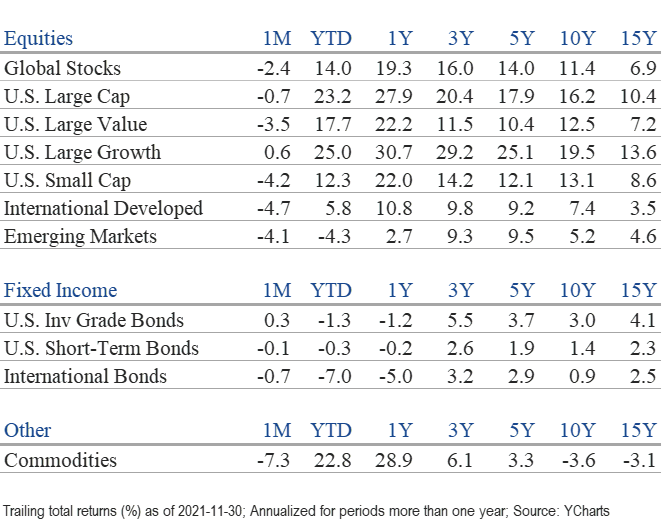
After closing at an all-time high on November 18th, the S&P 500 ended the month with a thud as the anxiety ridden Covid rollercoaster ride extended into its 22nd month. While the S&P 500 declined only -0.7% for the month, U.S. small-cap, International, and Emerging Market stocks were hit more harshly, down -4.2%, -4.7%, and -4.1%, respectively. International and Emerging Market stocks have broadly underperformed U.S. stocks amid generally more stringent Covid restrictions and more significant economic uncertainty. Among the 11 U.S. equity sectors, Technology led, up 4.4%, while Financials fared the worst, down -5.7%.
In bond markets, 10-year Treasury yields fell 11 basis points (bps) during the month as Omicron and economic growth concerns weighed on intermediate and long-term yields. At 1.45%, 10-year yields are 59 bps less than their 10-year average of 2.04%. Municipal (+0.85%), U.S. Treasury (+0.77%), and U.S. Aggregate Bond (+0.3%) indexes posted solid total returns mainly due to the late-month flight to quality and safety.
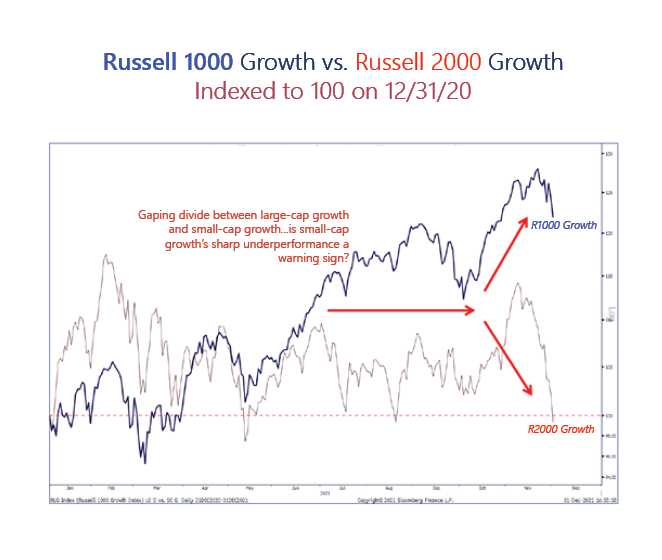
Looking forward to 2022, the prospects of higher inflation for longer and a potentially rising rate environment are both secular headwinds for P/E multiples. Despite suffering lagging performance for most of 2021, high P/E small-cap growth stocks were recently the hit hardest of all. Many of 2020’s top performers fell more than 20% last week alone. As of December 3, the average cloud software stock declined 33% from its highs.
Meanwhile, large-cap growth stocks continue to outperform, led by Apple and Microsoft. The two largest weights of the S&P 500 had previously never each exceeded 6%. Our Chart of the Month shows their remarkable divergence from small-cap growth since the Summer. Is the record gap a warning sign for the mega-cap tech stocks, or will small-cap tech stocks bounce off arguably oversold conditions?
Short-term disruptions create understandable discomfort, yet they tell us very little about the companies’ long-term prospects. As abruptly as stocks sold off from Omicron worst-case scenarios, they have rebounded just as sharply this week on early reports the new variant is milder than initially feared. Given the current tension between a reacceleration of economic growth and twin concerns of a more hawkish Fed and the haunting presence of a more persistent pandemic, we caution investors not to be surprised if recent elevated market volatility extends into 2022.
Insights by John Silvia, Director of Economics

The evolution of the economic fundamentals is a critical input for investors. Over the past two months, we have witnessed a reversal from tepid economic growth to a strong current quarter for growth. For inflation, the persistence of price pressures has led to a re-evaluation of the transitory inflation story to a view of sustained inflation going forward. Finally, monetary policy has accelerated the outlook for tapering and raising the funds rate in 2022.
- Employment gains and solid equipment orders/shipments signify anticipation for an extraordinarily strong fourth quarter of economic growth. There were broad-based job gains across private sectors of the economy, while the unemployment rate fell again and is approaching full employment.
- Core PCE inflation, the target of Fed policy, came in at 4.1% for October and has been significantly above the Fed’s 2% target for many months. While we may be seeing peak inflation numbers right now, sustained inflation above the Fed’s target compels investors to review their portfolios and revisit the inflation assumption implicit in their portfolios.
- Considering both the inflation and growth numbers, recent Fed governors and regional presidents’ commentary has indicated an acceleration of the reduction in their pace of asset purchases (tapering) with the completion of the rundown by mid-2022. At this time, market expectations have evolved to a position of rate hikes in 2022.
- For full-year 2021, economic growth is expected at 6%, with solid gains in consumer spending, residential investment, and business investment. Inflation rates have risen over the past year and will present challenges to investors as real returns on cash and sovereign debt continue to be negative. With the Federal Reserve now committed to reducing its expansionary policy, the stage is set for additional volatility in financial asset prices.
- Benchmark Treasury yields have risen in the last month as inflation concerns climbed and statements from Federal Reserve policymakers emphasized a move toward tapering is likely soon. Persistent inflation remains an issue for Treasury debt owners and buyers.
- In contrast to the issues of inflation, the strength in the dollar exchange rate reflects the gains in U. S. growth relative to the Euro as well as the difficulties faced in emerging markets.
- In terms of regulation and federal income taxes, economic policy remains a longer-term negative for investors. Any proposals for greater regulation and higher income/capital gains taxes represent a reduction in the expected rate of return on equity/corporate debt financial assets.
- Periods of accelerating and decelerating growth/inflation benchmarks can distract from the long-run goals of investors. Investment opportunities and risks change as the economic recovery often evolves due to changes in economic and policy.
Quote of the Month
“I don’t think volatility is an altogether irrelevant proxy for risk, even though, to a cool, dispassionate investor with a long-term time horizon, volatility is wonderful.”
Peter Bernstein – American Economist, Historian, and Investment Manager
Chart of the Month
The information published herein is provided for informational purposes only, and does not constitute an offer, solicitation or recommendation to sell or an offer to buy securities, investment products or investment advisory services. All information, views, opinions and estimates are subject to change or correction without notice. Nothing contained herein constitutes financial, legal, tax, or other advice. The appropriateness of an investment or strategy will depend on an investor’s circumstances and objectives. These opinions may not fit to your financial status, risk and return preferences. Investment recommendations may change, and readers are urged to check with their investment advisors before making any investment decisions. Information provided is based on public information, by sources believed to be reliable but we cannot attest to its accuracy. Estimates of future performance are based on assumptions that may not be realized. Past performance is not necessarily indicative of future returns. The following indexes were used as proxies in the performance tables: Global Stocks = MSCI ACWI; U.S. Large Cap = S&P 500; U.S. Large Value = Russell 1000 Value; U.S. Large Growth = Russell 1000 Growth; U.S. Small Cap = Russell 2000; Int’l Dev Stocks = MSCI EAFE; Emerging Markets = MSCI EM; U.S. Inv Grade Bonds = Barclays U.S. Aggregate; U.S. High Yield Bonds = Barclays Corporate High Yield; Emerging Markets Debt = JPMorgan EMBI Global Diversified; Int’l Bonds = Barclays Global Treasury ex US; Cash = 3month T-Bill; Sector returns displayed in the chart represent S&P 500 sectors, while treasury benchmarks are from Barclays
Chart of the Month Source: Strategas
Chart of the Month
Quote of the Month
“I don’t think volatility is an altogether irrelevant proxy for risk, even though, to a cool, dispassionate investor with a long-term time horizon, volatility is wonderful.”
Peter Bernstein – American Economist, Historian, and Investment Manager
Trailing Returns