Market Perspectives January 2022
Capital Markets
By: Wade Austin
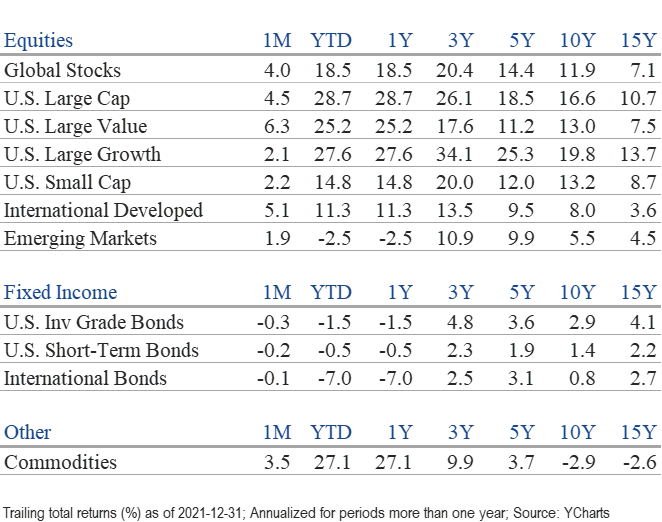
Global stocks recovered from the Omicron-induced, post-Thanksgiving selloff and finished December and the fourth quarter with robust gains. Covid couldn’t spoil another Santa Claus rally as global stocks surged late to post 4.0% gains for the month. During December’s last five trading days and the first two of January, the S&P 500 produced positive returns in 35 of the past 46 holiday seasons. The Santa Claus rally wasn’t just an American phenomenon. International developed stocks (+5.1%) led U.S. (+3.9%) and EM (+1.9%) peers, while commodities (+3.5%) also rebounded in December. The U.S. aggregate bond index declined modestly (-0.26%).
Vigorous economic activity in the fourth quarter and strong corporate earnings (full-year EPS growth is tracking at 49%) propelled the S&P 500 to a double-digit quarterly gain. Boosted by outsized gains from the mega-cap technology stocks, U.S. large-cap stocks (+11.0%) significantly outperformed U.S. small-caps (+2.1%), international developed (+3.1%), and EM (-1.3%) in Q4. The U.S. aggregate bond index was flat for the quarter.
2021 proved to be a surprisingly stellar year for U.S. assets, as U.S. stocks and bonds handily beat their foreign counterparts. Historic levels of fiscal and monetary stimulus aided U.S. markets in overcoming the ongoing headwinds from the Covid pandemic, supply-chain issues, and mounting inflation. M2 money supply grew 13% and the Fed’s balance sheet swelled 19%. Such aggressive stimulus also produced a benign year for the S&P 500 in terms of volatility. Its maximum intra-year drawdown of -5.2% ranks as the 9th mildest since 1950.
The S&P 500 recorded 70 new all-time highs in 2021, only trailing 1995’s 77 new highs. Its 28.7% total return marked the 36th 20%+ year since 1926. Notably, the S&P 500 outperformed the NASDAQ for the first time since 2016 and only the second time since 2011. Its outperformance over both the NASDAQ (5.5%) and the DJIA (8.2%) was the widest in 24 years. Of the 11 major sectors, Energy (+54.6%) and Real Estate (+46.2%) were the year’s top performers, completing a sharp reversal after ranking at the bottom in 2020. Utilities (+17.7%) were the laggard in 2021.
However, performance was more muted and choppier outside large-cap U.S. stocks. Both small-caps and EM stocks experienced corrections in 2021, defined as 10% – 20% declines. The Russell 2000 small-cap index closed the year trailing the S&P 500 by 13 points after leading by 14 points in mid-March, marking one of its largest reversals on record. EM was the best performing region among global equity indexes entering 2021 (after gaining 30% during the second half of 2020 alone) yet finished the year with negative returns (-2.5%). 10-year U.S. Treasury yields closed the year at 1.52% after starting at 0.93%. The abrupt 62% increase in the benchmark yield during 2021 resulted in a negative total return for the U.S. aggregate bond index (-1.54%). In other words, diversification outside the S&P 500 index (whether by size, style, geography, or asset class) weighed on portfolio returns.
Looking to the year ahead, the key factor affecting markets remains to bring the pandemic under control as Covid directly affects inflation’s persistence which will shape the pace of a broadening global tightening cycle. As revealed upon the release of its most recent meeting notes on January 5th, the Fed’s timeline for pivoting to quantitative tightening has accelerated to combat inflation. In a swift and aggressive reaction, 10-year U.S. Treasury yields rose 25 bps to 1.77%, and the NASDAQ shed 4.5% last week alone.
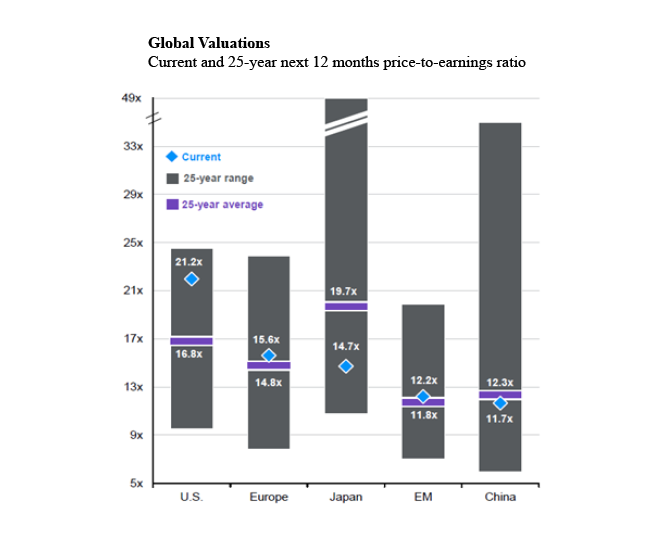
After years of underperformance, value stocks were productive in 2021. They may return to leadership in 2022 as valuation fundamentals likely become more appealing during an anticipated macroeconomic landscape defined by rising rates and elevated inflation. Our Chart of the Month suggests that international valuations look attractive over the next 12 – 18 months after years of S&P 500 dominance.
Insights by John Silvia, Director of Economics

Looking forward into 2022, the expectation is for slightly slower economic growth, but still above trend, slightly lower inflation, but still above target, and a Federal Reserve committed to reducing quantitative stimulus while also raising short-term interest rates. When we examine our leading economic indicators, such as claims and capital goods orders, the signals remain positive.
- December’s employment report strengthens the case for the Federal Reserve to raise the funds rate in March. Why? The unemployment rate fell to 3.9% which would meet most standards for full employment. Wages are up 4.7% over a year ago. According to the household survey, the three-month average gain in jobs is 723,000, while the establishment survey averaged 365,000 jobs over the same period. All these data points will keep the Fed on track for a March rate increase.
- For inflation, the persistence of price pressures has led the Federal Reserve to drop the transitory inflation story and now expects sustained inflation going forward. This has accelerated the Fed’s outlook for tapering and raising the funds rate in 2022.
- The latest survey of manufacturing purchasing agents provides a good perspective. First, the overall index and the production and orders components support the case for economic growth. The employment component indicates further job gains and thereby personal income/spending growth. The order backlogs intimate that supply chain issues remain an issue.
- The manufacturing survey provides evidence for a reduction in input/commodity pressures, but the level of these pressures suggests rising prices – just at a slower pace than we witnessed last quarter. Core PCE inflation, the target of Fed policy, came in at 4.8% for the last three months as of November and 4.7% over a year ago. These numbers are significantly above the Fed’s target of 2%.
- For all of 2022, economic growth is expected at 4.2% with strong gains in consumer spending, residential investment, and business investment. Slower economic growth tends to be associated with slower profit growth—especially in an environment of rising interest rates. Core consumer inflation is a challenge to investors as real returns on cash and sovereign debt continue negative. With the Federal Reserve now committed to reducing its expansionary policy, the stage is now set for additional volatility in financial asset prices.
- Benchmark Treasury yields have already risen in the past month as inflation concerns have climbed. Persistent inflation remains an issue for Treasury debt owners and buyers. Expectations are for the 10-year Treasury yield to approach 2.0% by year end.
- In contrast to the issues of inflation, the strength in the dollar exchange rate reflects the gains in U.S. growth relative to the Euro as well as the difficulties faced by Turkey and emerging markets.
- Economic policy, in terms of regulation and federal income taxes, remains a longer-term negative for investors. Any proposals for greater regulation and higher income/capital gains taxes represent a reduction in the expected rate of return on equity/corporate debt financial assets.
- Periods of accelerating and decelerating growth/inflation benchmarks can distract from the long-run goals of investors. Investment opportunities and risks change as the economic recovery evolves often due to economic and policy changes. Our view is that the economic outlook in 2022 will not be a repeat of 2021 and will be more challenging for investors.
Quote of the Month
“The intelligent investor should recognize that market panics can create great prices for good companies and good prices for great companies.”
Benjamin Graham – American Economist, Professor, and Investor
Chart of the Month
The information published herein is provided for informational purposes only, and does not constitute an offer, solicitation or recommendation to sell or an offer to buy securities, investment products or investment advisory services. All information, views, opinions and estimates are subject to change or correction without notice. Nothing contained herein constitutes financial, legal, tax, or other advice. The appropriateness of an investment or strategy will depend on an investor’s circumstances and objectives. These opinions may not fit to your financial status, risk and return preferences. Investment recommendations may change, and readers are urged to check with their investment advisors before making any investment decisions. Information provided is based on public information, by sources believed to be reliable but we cannot attest to its accuracy. Estimates of future performance are based on assumptions that may not be realized. Past performance is not necessarily indicative of future returns. The following indexes were used as proxies in the performance tables: Global Stocks = MSCI ACWI; U.S. Large Cap = S&P 500; U.S. Large Value = Russell 1000 Value; U.S. Large Growth = Russell 1000 Growth; U.S. Small Cap = Russell 2000; Int’l Dev Stocks = MSCI EAFE; Emerging Markets = MSCI EM; U.S. Inv Grade Bonds = Barclays U.S. Aggregate; U.S. High Yield Bonds = Barclays Corporate High Yield; Emerging Markets Debt = JPMorgan EMBI Global Diversified; Int’l Bonds = Barclays Global Treasury ex US; Cash = 3month T-Bill; Sector returns displayed in the chart represent S&P 500 sectors, while treasury benchmarks are from Barclays
Chart of the Month Source: FactSet, MSCI, Standard & Poor’s, Thomson Reuters, J.P. Morgan Asset Management
Chart of the Month
Quote of the Month
“The intelligent investor should recognize that market panics can create great prices for good companies and good prices for great companies.”
Benjamin Graham – American Economist, Professor, and Investor
Trailing Returns