Market Perspectives September 2020
Capital Markets
By: Wade Austin
Following July’s strong performance and entering a softer stretch of the calendar, many assumed equity markets would take a breather in August. However, investors’ risk-on appetite accelerated in August as the S&P 500 gained 7.2% and closed at 3500, already surpassing the pre-Covid all-time high of 3386 set on February 19th. Leading the surge, technology stocks vaulted the NASDAQ index 11.2% higher-its 4th best month ever. U.S. Small Caps, International, and Emerging Market equity indexes posted solid gains as well.
The gap between S&P 500 Growth and Value stocks extended to historically extreme levels by month end (YTD total returns were 26.5% vs. -9.3%, respectively). Yet, it’s worth noting that Value gained a very healthy 3.6% in August, and cyclical sectors such as Materials and Industrials quietly had strong momentum.
In fixed income markets, U.S. 10-Year Treasury yields closed August at 0.71% – up 18 basis points during the month (they began the year at 1.92%). Of note, equity dividend yields are higher: S&P 500 (1.7%), International (2.8%), and EM (2.1%). With intermediate yields ticking up, the U.S. Aggregate Bond Index declined -0.8%. Short-term bonds were mostly flat, while the High Yield Bond Index was up 1.0%. With large U.S. corporate bankruptcy filings on the rise and on pace to exceed 2009 levels, caution is warranted in non-investment grade debt.
On August 27th, the Federal Reserve announced that instead of targeting 2% inflation, it will now target an inflation rate that “averages 2% over time”. This strategic policy shift is designed to provide the labor market and overall economy with additional support by keeping short-term interest rates low. Massive monetary and fiscal stimulus, low interest rates, and recently declining U.S. Covid-19 rates (mortality, hospitalization, and cases) have provided powerful tailwinds for equity markets.
Clearly, risks remain elevated. Given lofty valuations, markets are vulnerable to disappointments and near-term pullbacks as experienced in early June and again at the time of this writing. The correction in mega-cap technology stocks may prove to be a healthy consolidation of recent extraordinary gains or the beginning of a leadership shift from growth to value.
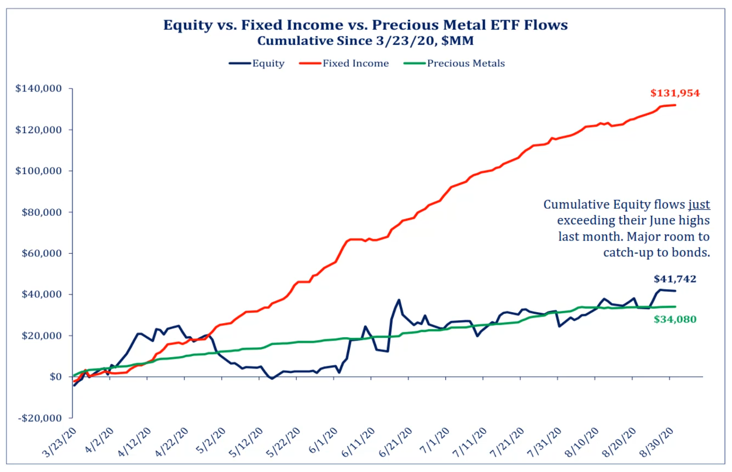
Valuation metrics are more reliable as a risk management tool than a timing mechanism. Both equities and bonds appear fully valued at current interest rates. In our Chart of the Month, ETF flows since the March 23rd S&P 500 low suggests investor sentiment excesses lie in fixed income, not equities.
Insights by John Silvia, Director of Economics

Each month we review the jobs numbers published by the federal government for insights into the state of the economy, personal income, and industrial production. For August, the job gains were widespread among industries and ethnic groups supporting the case for continued economic recovery.
- Total nonfarm payrolls rose by 1.4M. By sector, there were solid gains in manufacturing, construction, retail trade (reflecting the reopening of many states), professional and business services, leisure, education, and the federal government (reflecting Census workers hired).
- The unemployment rate fell to 8.4% – declining for adult men, adult women, and teenagers among most demographic groups.
What does all this mean?
- Job gains, along with wage gains, indicate improvement in household incomes. Job gains in construction and manufacturing support economic output.
- The outlook for positive economic growth continues to be supported by the basic leading indicators we follow (claims, building permits, factory orders and consumer sentiment).
However, there is no going back to normal.
- First, job gains will take several years to return to pre-shutdown levels. Our view that the recovery will not be V-shaped is panning out. Unemployment rates, particularly for teenagers and non-high school graduates will remain above pre-shutdown levels for several years.
- Second, the character of many jobs will be altered, as each recession brings change. As investors, we must recognize the changes and adapt our portfolio accordingly. Travel and leisure sectors will take some time to find a new style of delivering consumer value. The application of technology for digitization and secure communications will be paramount. On-line shopping will continue to gain market share. Finally, healthcare will be a sustained, not short-run, winner.
Quote of the Month
“The first rule of compounding: Never interrupt it unnecessarily.”
Charlie Munger – Vice Chairman, Berkshire Hathaway
Chart of the Month
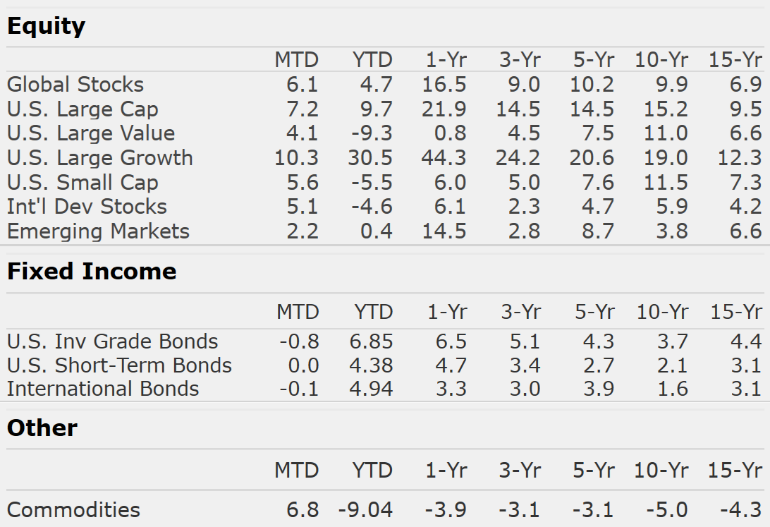
The information published herein is provided for informational purposes only, and does not constitute an offer, solicitation or recommendation to sell or an offer to buy securities, investment products or investment advisory services. All information, views, opinions and estimates are subject to change or correction without notice. Nothing contained herein constitutes financial, legal, tax, or other advice. The appropriateness of an investment or strategy will depend on an investor’s circumstances and objectives. These opinions may not fit to your financial status, risk and return preferences. Investment recommendations may change, and readers are urged to check with their investment advisors before making any investment decisions. Information provided is based on public information, by sources believed to be reliable but we cannot attest to its accuracy. Estimates of future performance are based on assumptions that may not be realized. Past performance is not necessarily indicative of future returns. The following indexes were used as proxies in the performance tables: Global Stocks = MSCI ACWI; U.S. Large Cap = S&P 500; U.S. Large Value = Russell 1000 Value; U.S. Large Growth = Russell 1000 Growth; U.S. Small Cap = Russell 2000; Int’l Dev Stocks = MSCI EAFE; Emerging Markets = MSCI EM; U.S. Inv Grade Bonds = Barclays U.S. Aggregate; U.S. High Yield Bonds = Barclays Corporate High Yield; Emerging Markets Debt = JPMorgan EMBI Global Diversified; Int’l Bonds = Barclays Global Treasury ex US; Cash = 3month T-Bill; Sector returns displayed in the chart represent S&P 500 sectors, while treasury benchmarks are from Barclays
Sources: Strategas
Chart of the Month
Quote of the Month
“The first rule of compounding: Never interrupt it unnecessarily.”
Charlie Munger – Vice Chairman, Berkshire Hathaway
Trailing Returns