Market Perspectives – September 2018
Capital Markets
The S&P 500 reached all-time highs in August and eventually pushed through the 2,900 milestone for the first time ever on August 28th. After hitting record highs in each of the 12 months of 2017, the latest milestone was the first all-time high recorded since January. The U.S. stock market performed well during the month across all market caps and styles. For the year, small cap stocks and large cap growth stocks have been the big winners. Value stocks have lagged again in 2018 but are still positive.
Foreign stocks, both international developed and emerging markets, struggled again in August. U.S. Dollar appreciation, likely due to ongoing trade tensions, has strongly hurt the performance of international stocks. Frequent readers of Market Perspectives know that we believe in managing global portfolios and we also think that the expected return for international and emerging markets stocks over the next 5-10 years are higher than U.S. stocks. Valuations on international and emerging markets stocks are lower, on a relative basis, when compared to U.S. stocks. We ultimately believe that valuations drive returns. However, in shorter periods of time, momentum drives performance. Clearly, momentum is on the side of U.S. growth stocks and we don’t dismiss the idea that the momentum could continue for some time.
In fixed income markets, ongoing Federal Reserve tightening has predictably driven short-term interest rates higher while longer-term rates have not moved much in recent months. The yield curve is now the flattest it has been since the Great Recession. A portfolio of short-term bonds yields almost as much as a portfolio of long-term bonds, but carries significantly less interest rate risk. We continue to favor a short duration posture. Further, high yield bonds have held up extremely well but they currently yield just over 3% more than comparably maturing Treasury bonds. To put this into context, in 2007, before the financial crisis, cash yielded over 5%. Today, high yield bonds, the same instruments that experienced a more than 30% drop in value in the crisis, yield just over 6% before loss adjustments. In short, the present time is a good time for investors to evaluate the risk in their fixed income portfolios. An over-reliance on long-duration bonds or riskier fixed income instruments could be dangerous in the coming years.
Market Liquidity
What is liquid today, may not be liquid later. We spend a lot of time thinking about risks in investment portfolios. We focus most on downside risk and loss of capital. At the end of the day, permanently losing capital is risk defined. A similar risk is liquidity. When we say liquidity, what do we mean? How fast can you sell the asset and for how much of a discount do you have to sell the asset to get the money back soon. A few thoughts:
- Residential real estate is the best illustration for liquidity. During the housing crisis, there were more than 2 years of inventory on the market and a quick sale could have required a deep discount of the home (more than 20% for most homes).
- Today, most homes of average price (particularly in growing cities such as Charlotte, NC) are selling for their asking prices within a matter of a few days, typically closing in a month or two.
- As we have seen in the past, liquidity is dynamic and goes and comes. When we experience bad times, fewer investors are willing to be a liquidity provider and more investors are asking for a liquidity provider. Hence, there is less liquidity.
- Historically speaking, most economic cycles end after a long period of growing liquidity. Investors, as they grow confident in markets, will tend to take on more risk to achieve higher returns. This risk taking, often through leverage, increases values on assets and provides an illusion of liquidity. Investors see the liquidity and then trust it will always be there. But the question is, if you need the money during a bad time, can you get it without sacrificing much value?
- After so many years of growing liquidity and growing leverage in the economy, I think now is a great time to reconsider how much liquidity you really have and really need.
- What does this mean on a personal level? Make sure you hold emergency cash that can cover your living expenses. Ensure that an appropriate level of your portfolio is invested in highly liquid, high quality fixed income that could be tapped as a second level of insurance. Lastly, having the ability to be a liquidity provider can be quite lucrative, especially during bad times. Locking up capital may offer a premium today, but having extra liquidity on hand to take advantage during a dislocation could be extremely lucrative tomorrow.
By: Dustin Barr, CFA
All data sourced from Morningstar Direct unless otherwise noted. The information published herein is provided for informational purposes only, and does not constitute an offer, solicitation or recommendation to sell or an offer to buy securities, investment products or investment advisory services. All information, views, opinions and estimates are subject to change or correction without notice. Nothing contained herein constitutes financial, legal, tax, or other advice. The appropriateness of an investment or strategy will depend on an investor’s circumstances and objectives. These opinions may not fit to your financial status, risk and return preferences. Investment recommendations may change and readers are urged to check with their investment advisors before making any investment decisions. Information provided is based on public information, by sources believed to be reliable but we cannot attest to its accuracy. Estimates of future performance are based on assumptions that may not be realized. Past performance is not necessarily indicative of future returns. The following indexes were used as proxies in the performance tables: Global Stocks = MSCI ACWI; U.S. Large Cap = S&P 500; U.S. Large Value = Russell 1000 Value; U.S. Large Growth = Russell 1000 Growth; U.S. Small Cap = Russell 2000; Int’l Dev Stocks = MSCI EAFE; Emerging Markets = MSCI EM; U.S. Inv Grade Bonds = Barclays U.S. Aggregate; U.S. High Yield Bonds = Barclays Corporate High Yield; Emerging Markets Debt = JPMorgan EMBI Global Diversified; Int’l Bonds = Barclays Global Treasury ex US; Cash = 3month T-Bill; Sector returns displayed in the chart represent S&P 500 sectors, while treasury benchmarks are from Barclays
Quote of the Month
“Liquidity is ephemeral: it can come and go.”
Howard Marks
Chart of the Month
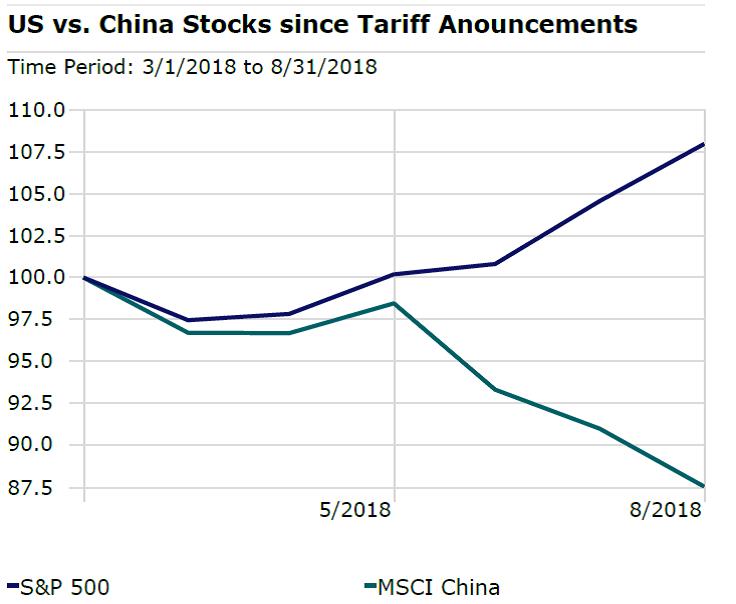
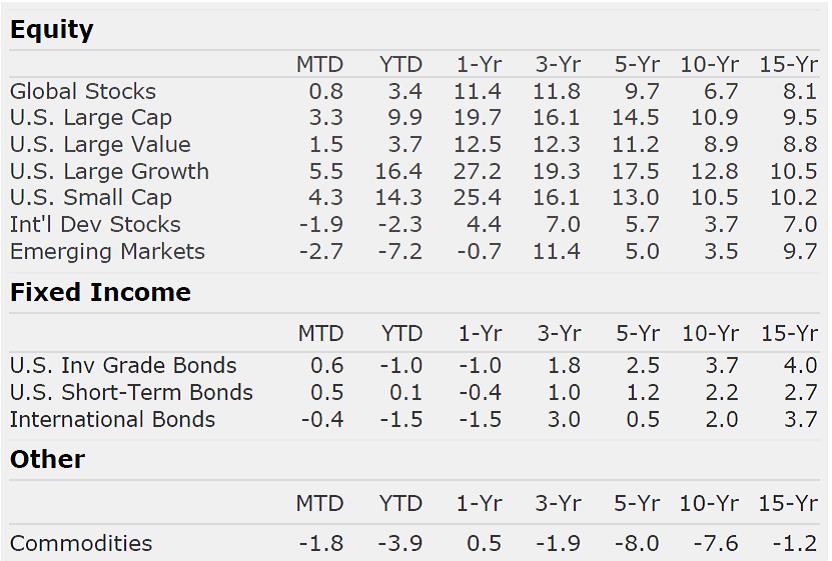
Chart of the Month
Quote of the Month
“Liquidity is ephemeral: it can come and go.”
Howard Marks
Trailing Returns