Market Perspectives – November 2018
Capital Markets
After posting its strongest quarterly returns in many years, the S&P 500 and the global stock market experienced its worst month since 2011. The S&P 500 reached correction territory (-10% decline) in October before posting strong gains the final two days of the month. From November 2016 through January 2018, the markets saw no negative monthly returns. Since then, we have experienced two 10% corrections. It’s important to remember that the average year in the stock market sees a correction of 14%. Thus, the volatility we have seen is relatively normal. International and emerging markets stocks continue to feel the sharp pains of the ongoing trade spat and geopolitical issues.
Unlike most corrections, October’s was unique in that the long time leaders in this 10 year old bull market turned into the laggards on the way down. Notably, small cap stocks and large cap growth stocks (driven by the large tech companies) led the way down.
Interest rates continued to rise in October, making this correction a particularly frustrating one for investors with diversified portfolios. The Federal Reserve has indicated that they are not slowing the pace of rate hikes in the near term, and interest rates have acted accordingly.
No one can know for sure what will happen next. Leading indicators are generally mixed with economic data, consumer sentiment, and earnings generally positive. Conversely, valuation levels, debt levels, and technical factors are all consistent with previous bull market tops. Now is not the time to take excess risk, but it also isn’t the time to panic. This is a great time to take a pulse check on your current risk level and your current risk tolerance.
There Are No Free Lunches
Diversification, over long periods of time, can get you where you want to go in a smoother and happier way. That all sounds great! But like all things, diversification isn’t a free lunch. In fact, some years it eats your lunch! A few thoughts on what hasn’t been working and why:
- In recent years, owning international stocks has been a drag. This has led some to ask why they own them in the first place.
- From 1970 through 2008, an allocation to international stocks increased returns and lowered risk for U.S. investors. Since 2008, risk has been higher and returns have been lower with international stocks.
- The problem with diversification is that there will always be something you own that won’t work. While international stocks have had a very bad run for many years, we think they have a much higher expected return over the next 5 year period. Trying to time exactly when international will outperform is pure folly.
- Today, international and emerging market currencies are near all-time lows compared to the U.S. Dollar
- Further, international stocks pay higher dividends and higher shareholder yields, and trade at lower valuations (P/E, P/CF, P/BV, P/S) than U.S. stocks.
- We don’t know when things will turn, but we do suspect they will. Now is not the time for less diversification.
By: Dustin Barr, CFA
All data sourced from Morningstar Direct unless otherwise noted. The information published herein is provided for informational purposes only, and does not constitute an offer, solicitation or recommendation to sell or an offer to buy securities, investment products or investment advisory services. All information, views, opinions and estimates are subject to change or correction without notice. Nothing contained herein constitutes financial, legal, tax, or other advice. The appropriateness of an investment or strategy will depend on an investor’s circumstances and objectives. These opinions may not fit to your financial status, risk and return preferences. Investment recommendations may change and readers are urged to check with their investment advisors before making any investment decisions. Information provided is based on public information, by sources believed to be reliable but we cannot attest to its accuracy. Estimates of future performance are based on assumptions that may not be realized. Past performance is not necessarily indicative of future returns. The following indexes were used as proxies in the performance tables: Global Stocks = MSCI ACWI; U.S. Large Cap = S&P 500; U.S. Large Value = Russell 1000 Value; U.S. Large Growth = Russell 1000 Growth; U.S. Small Cap = Russell 2000; Int’l Dev Stocks = MSCI EAFE; Emerging Markets = MSCI EM; U.S. Inv Grade Bonds = Barclays U.S. Aggregate; U.S. High Yield Bonds = Barclays Corporate High Yield; Emerging Markets Debt = JPMorgan EMBI Global Diversified; Int’l Bonds = Barclays Global Treasury ex US; Cash = 3month T-Bill; Sector returns displayed in the chart represent S&P 500 sectors, while treasury benchmarks are from Barclays
Quote of the Month
“Risk means more things can happen than will happen.”
Elroy Dimson
Chart of the Month
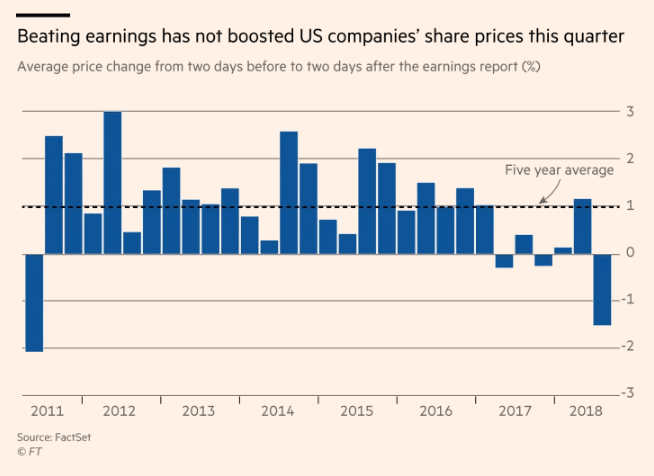
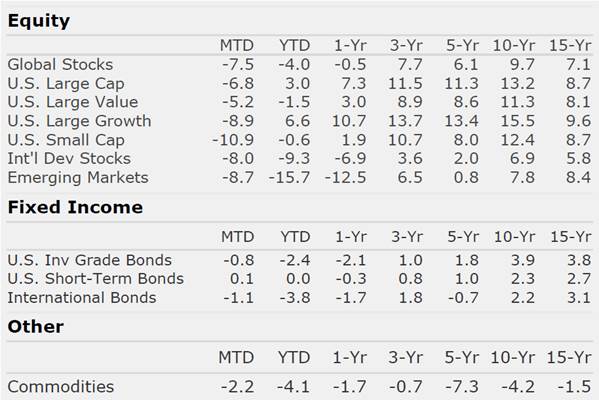
Chart of the Month
Quote of the Month
“Risk means more things can happen than will happen.”
Elroy Dimson
Trailing Returns