Market Perspectives June 2021
Capital Markets
By: Wade Austin
Driven by a rapid lifting of economic restrictions throughout most of the U.S., stocks in May posted their fourth consecutive month of gains as the S&P 500 closed at 4,204 – just 0.67% below its all-time high. Once again, the old Wall Street adage ‘Sell in May and Go Away’ was proven wrong. For the record, July is historically the worst performing month, but that does not rhyme.
With 488 of the S&P 500 companies having reported their Q1 earnings, 85% beat their consensus estimate – the highest percentage beat in nine years. The more economically sensitive value stocks continued to outperform as large cap growth stocks slipped – 1.4% during the month. Seven of the 11 sectors posted gains led by Energy which surged 5.8%. After lagging for years, value stocks are handily besting growth in 2021 (18.4% vs. 6.3%). Overseas equities (led by international developed stocks gaining 3.3% and emerging markets stocks up 2.3%) surged in May aided by increasing vaccination rates and a weakening U.S. dollar.
After retreating from its March 31st high during April, the 10-year U.S. Treasury yield fluctuated in a tight range before closing May – flat for the month at 1.60%. Despite the abrupt rise in yields during Q1, the 10-year remains unusually low. It has averaged 2.08% over the past 10 years. While the Federal Reserve meeting notes revealed some members’ initial willingness to begin tapering discussions, most investors do not expect action any time soon. ECB officials in Europe continue to remain dovish as the COVID recovery there lags the U.S. and most of Asia.
Monthly returns were broadly positive across Fixed Income sectors with the only exception being a slight decline among U.S mortgage-backed securities. After posting their worst quarterly return since 1980 in Q1, U.S. investment grade bonds rebounded in April and gained another 0.77% in May. High yield municipal bonds (+1.15%) were the month’s top fixed income performer as robust demand swamped limited supply. Municipal bonds’ strong technical and fundamental factors attracted investors considering higher future tax rates.
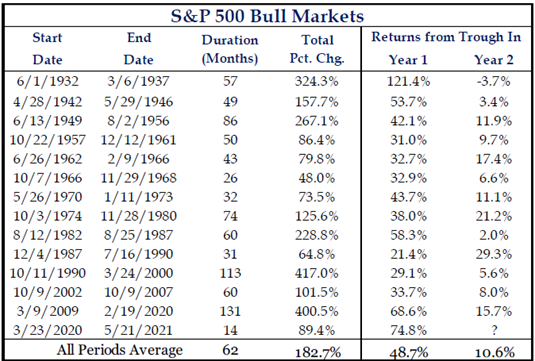
The persistent increases in inflation data this Spring are becoming difficult to ignore despite the Federal Reserve’s insistence that recent spikes are likely transitory. With the lifting of economic and travel restrictions, inflation and supply shortages are real for consumers – whether dining out, filling up the tank, or buying a home. However, pent-up consumer demand, elevated personal savings accounts, and shock and awe fiscal stimulus are also boosting economic activity and producing stellar corporate earnings growth. As a result, investors have found it difficult to reduce equity exposure or shift from this year’s pro-value tilt. The threat of rising, disorderly inflation continues to be a key risk for markets among most investors and exhibit A for why the second year of a bull market is more difficult than the first (see our Chart of the Month).
Insights by John Silvia, Director of Economics

Last week’s jobs report for May provided further evidence for the positive outlook for the economy based upon a reading of leading economic indicators such as jobless claims, factory orders/shipments, building permits and consumer sentiment. Job gains were present across the major employment categories with a very large gain in the leisure & hospitality sector as many states open even more. Gains were broad-based with improvement in education, health care and manufacturing. In addition, the unemployment rate fell below 6%.
- For all of 2021, economic growth is expected to be 6% with strong gains in consumer spending and business investment. Inflation rates have risen over the past year and are expected to present some challenges to investors.
- Until recently, the trajectory of inflation, and inflation expectations, were low enough to keep the Fed on hold and short-term interest rates low. However, with inflation rising, longer-term interest rates have tended to follow. In December 2020, the ten-year rate averaged 0.9% and for May the rate was 1.6%.
- Rising inflation and benchmark interest rates, along with a steady decline in the U.S. dollar value, command a review of your investment strategy with respect to holdings of cash and U.S. treasury debt in your portfolio.
- Investment opportunities change as the economic recovery evolves often due to changes in inflation, interest rates and the value of the dollar. In addition, a new political administration has introduced new priorities with respect to taxes, energy development and infrastructure. All of these require further review of your portfolio.
- Clients have been rewarded by following the fundamentals and taking a longer view of their position. Recessions are part of the economic cycle, but recovery and expansion are longer lasting. This has not changed.
- Clients are also rewarded by recognizing that the economy evolves and political priorities change. Our investment priorities will change as well.
Quote of the Month
“The arithmetic makes it plain that inflation is a far more devastating tax than anything that has been enacted by our legislatures. The inflation tax has a fantastic ability to simply consume capital.”
Warren Buffett
Chart of the Month
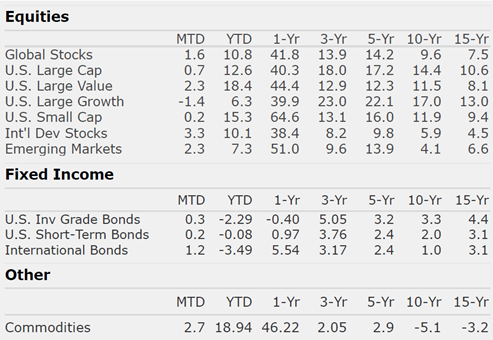
The information published herein is provided for informational purposes only, and does not constitute an offer, solicitation or recommendation to sell or an offer to buy securities, investment products or investment advisory services. All information, views, opinions and estimates are subject to change or correction without notice. Nothing contained herein constitutes financial, legal, tax, or other advice. The appropriateness of an investment or strategy will depend on an investor’s circumstances and objectives. These opinions may not fit to your financial status, risk and return preferences. Investment recommendations may change, and readers are urged to check with their investment advisors before making any investment decisions. Information provided is based on public information, by sources believed to be reliable but we cannot attest to its accuracy. Estimates of future performance are based on assumptions that may not be realized. Past performance is not necessarily indicative of future returns. The following indexes were used as proxies in the performance tables: Global Stocks = MSCI ACWI; U.S. Large Cap = S&P 500; U.S. Large Value = Russell 1000 Value; U.S. Large Growth = Russell 1000 Growth; U.S. Small Cap = Russell 2000; Int’l Dev Stocks = MSCI EAFE; Emerging Markets = MSCI EM; U.S. Inv Grade Bonds = Barclays U.S. Aggregate; U.S. High Yield Bonds = Barclays Corporate High Yield; Emerging Markets Debt = JPMorgan EMBI Global Diversified; Int’l Bonds = Barclays Global Treasury ex US; Cash = 3month T-Bill; Sector returns displayed in the chart represent S&P 500 sectors, while treasury benchmarks are from Barclays
Sources: Strategas
Chart of the Month
Quote of the Month
“The arithmetic makes it plain that inflation is a far more devastating tax than anything that has been enacted by our legislatures. The inflation tax has a fantastic ability to simply consume capital.”
Warren Buffett
Trailing Returns