Market Perspectives July 2020
Capital Markets
By: Wade Austin
2Q 2020 felt like the longest, slowest three months for many, but in capital markets, everything moved at warp speed. Virtually overnight, we experienced a recession by proclamation, sparking a bear market and -34% S&P 500 decline in only 23 days. The average initial 23-day bear market decline was only -5%. Volatility, as measured by the VIX index, exploded to an all-time high while U.S. 10-Yr Treasury yields plunged twice as abruptly as during 2008 to all-time lows.
Largely due to the swiftness of the Federal Reserve and government’s massive stimulus, markets quickly stabilized. Economic re-openings in May paved the way for the markets’ continued rebound. Equities peaked on June 8th, but they remained remarkably resilient afterward given the uncertain view of corporate earnings and ugly headlines dominating the news.
The S&P 500 posted a quarterly 20.5% total return (the 3rd best since 1950) within 3.1% of 2019’s close. The technology-laden NASDAQ sprinted to record highs (up 30.6% for the quarter) while International and Emerging Markets climbed 14.9% and 15.1%, respectively. Bonds (the Barclays Aggregate) gained a healthy 2.9%.
After two months of surprisingly strong economic data, the recession is technically already over! A bear market associated with a recession has never lasted just four weeks. Yet, it appears we could be in the early stages of the next bull market. What a whirlwind indeed!
Containment and cure of the virus remains a challenge, but in our April edition, we expressed optimism that the best U.S. scientific minds could develop effective solutions to the pandemic. Despite cases currently surging to prior Spring peak levels, the mortality rate has steadily declined, thankfully. Consumer sentiment (78.1% June reading) and the markets are gaining confidence that the virus and the economy can co-exist in a low risk, responsible manner until a vaccine or herd immunity emerges.
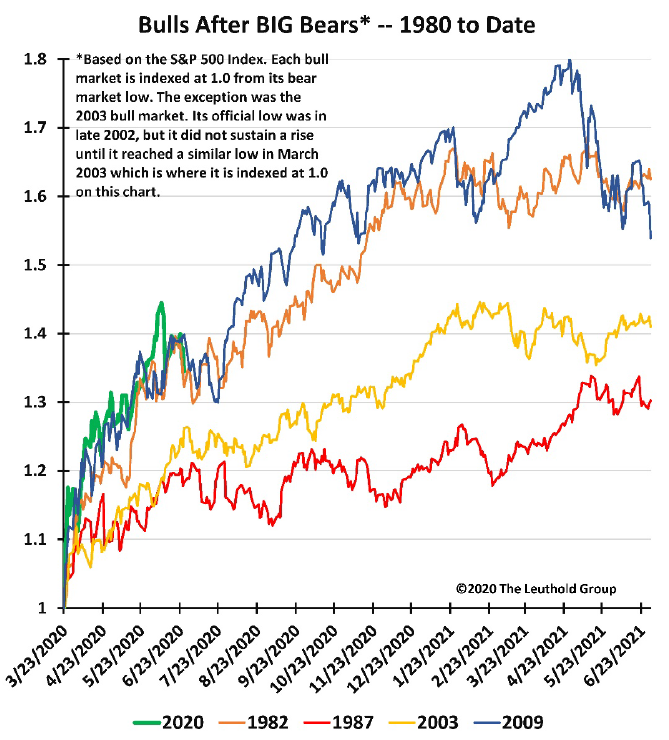
For all the talk about “new normals”, the equity markets are recovering along a familiar path. Hazards remain, but as shown in our Chart of the Month, the early stages of the past four bull markets were not immune to pullbacks or even corrections. However, patient investors were rewarded for staying invested.
Insights by John Silvia, Director of Economics

Three trends in the economy are emerging out of the data for the last two months.
- Leading economic indicators, such as jobless claims, building permits, factory orders and consumer confidence, continue to improve. Financial leading indicators, such as credit spreads, commodity prices and Treasury yields also support the case for growth.
- The gains in employment, retail sales and new home sales indicate the economy has emerged from recession and will register growth in the current quarter.
- There is no V-shaped recovery as the strength and volatility of the economy will be shaped by the state-by-state shutdowns and pace of re-openings.
Yet, there are two trends that bear watching for the long-run outlook.
- As we have highlighted before, patterns in the economy and financial markets signal there is certainly much restructuring to be done. That will take years, but the big shock has passed. For the economy, the application of technology for secure communication, both electronically and visually, will be paramount. On-line shopping continues to gain a large share of the consumer wallet. Finally, health care will be a sustained, not short-run, winner.
- On the downside, these changes indicate structural challenges that are already becoming apparent in the distribution of job gains and the higher unemployment rates for lesser educated workers.
Of course, these are the indicators we follow each week and each month, and we update them for your advisor.
Quote of the Month
“Skate to where the puck is going, not where it has been.”
Wayne Gretzky
Chart of the Month
The information published herein is provided for informational purposes only, and does not constitute an offer, solicitation or recommendation to sell or an offer to buy securities, investment products or investment advisory services. All information, views, opinions and estimates are subject to change or correction without notice. Nothing contained herein constitutes financial, legal, tax, or other advice. The appropriateness of an investment or strategy will depend on an investor’s circumstances and objectives. These opinions may not fit to your financial status, risk and return preferences. Investment recommendations may change, and readers are urged to check with their investment advisors before making any investment decisions. Information provided is based on public information, by sources believed to be reliable but we cannot attest to its accuracy. Estimates of future performance are based on assumptions that may not be realized. Past performance is not necessarily indicative of future returns. The following indexes were used as proxies in the performance tables: Global Stocks = MSCI ACWI; U.S. Large Cap = S&P 500; U.S. Large Value = Russell 1000 Value; U.S. Large Growth = Russell 1000 Growth; U.S. Small Cap = Russell 2000; Int’l Dev Stocks = MSCI EAFE; Emerging Markets = MSCI EM; U.S. Inv Grade Bonds = Barclays U.S. Aggregate; U.S. High Yield Bonds = Barclays Corporate High Yield; Emerging Markets Debt = JPMorgan EMBI Global Diversified; Int’l Bonds = Barclays Global Treasury ex US; Cash = 3month T-Bill; Sector returns displayed in the chart represent S&P 500 sectors, while treasury benchmarks are from Barclays
Sources: CIC, Morningstar Direct, and The Leuthold Group
Chart of the Month
Quote of the Month
“Skate to where the puck is going, not where it has been.”
Wayne Gretzky
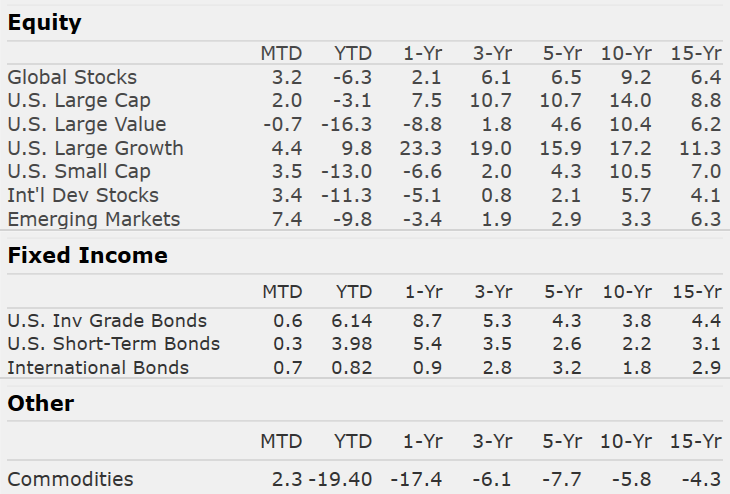
Trailing Returns