Market Perspectives – July 2017
Capital Markets
The first half of 2017 experienced very strong returns, given we are in the late stages of the bull market. With U.S. stocks returning more than 9% in the first six months and international stocks delivering double digit returns, the results look more like a strong 12-month period rather than just six months.
While many have declared the “Trump rally” to have continued from November to June, it’s notable that leadership changes have been stark and that technology and healthcare (both laggards immediately after the election) have led the way this year. Facebook, Amazon, Apple, Microsoft, and Google have delivered incredibly strong returns and have contributed most of the equity market strength so far in 2017. In fact 7 of the top 10 largest companies in the S&P 500 accounted for 30% of the S&P 500’s first half return but just 13% of the weight of the index.
Post-election, much was made about the U.S. Dollar’s continued rise in value vs. most currencies. Since 2014, the Dollar has risen dramatically and was at its highest levels in more than a decade. Nearly every investment strategist seemed to predict the Dollar would go much higher and dramatically harm emerging market countries. The Dollar has instead sunk to levels lower than before the election. Frequent readers of Market Perspectives will recall that we favor international equities and believed the dramatic Dollar strength over the last few years would begin to abate at some point, becoming a tailwind for struggling international stocks. We had no idea when the tide would turn and certainly didn’t think it would have happened so quickly. Nevertheless, it’s a great example of how you have to be both right and non-consensus to see outsized returns.
The Federal Reserve raised rates twice in the first half and cash rates are now over 1%. We are pleased to see markets behave well as the Fed has embarked on its exit strategy but are concerned about longer-term rates as they have stayed very low. As markets go higher, cash pays more, and longbonds stay low, the case for having more exposure to cash will become more compelling.
Overconfidence
Nearly every day on CNBC or Bloomberg TV a Wall Street bank or large investment management firm’s strategist can be found discussing what is about to happen in the markets. Typically, the strategist is asked how stocks will perform this year. Most often, the strategist will provide a specific price target for the stock market. The strategist, like most investors, is clearly exhibiting an overconfidence bias. So what is a reasonable answer for “how will stocks perform over the next year?”
- We project the long-term return of the stock market to be about ~8% annually over history with standard deviation (volatility) of ~15%
- Based on this assessment, the answer to the question should be:
- “The best guess of a return would be 8% for any given year. We can guess with about 68% certainty that the returns this year will be between -7% and +23% (+/- 15% from the 8% target). We can guess with about 95% confidence that the returns will be between -22% and +38% over the next 12 months (+/- (15*2)) from the 8% target) and with 99% confidence that the returns will be -37% and +53% (+/- (15*3)) from the 8% target.”
- Can you imagine the facial expression of the CNBC anchor if a Wall Street analyst told her that they were 99% sure the returns would be between -37% and +53%?! It’s almost certain that the strategist would never be seen on TV again.
Over the last decade, a plethora of academic research has identified key biases that we all exhibit. One of the most dangerous biases to investing is overconfidence. It turns out that humans are not very strong statisticians. Notably, human beings respond extremely favorably to stories. This is why very few of us object to the absurdly specific responses that “experts” give us on TV. Often stories can be used to manipulate decision making while remaining completely blind to statistics. Before making big investment or life decisions, it is advisable that we use reasoning to overrule emotions. Take a step back and ask what are the chances of this going right and wrong. Trying to thoughtfully play devil’s advocate before taking the plunge can do wonders for our decision-making success.
The information published herein is provided for informational purposes only, and does not constitute an offer, solicitation or recommendation to sell or an offer to buy securities, investment products or investment advisory services. All information, views, opinions and estimates are subject to change or correction without notice. Nothing contained herein constitutes financial, legal, tax, or other advice. The appropriateness of an investment or strategy will depend on an investor’s circumstances and objectives. These opinions may not fit to your financial status, risk and return preferences. Investment recommendations may change and readers are urged to check with their investment advisors before making any investment decisions. Information provided is based on public information, by sources believed to be reliable but we cannot attest to its accuracy. Estimates of future performance are based on assumptions that may not be realized. Past performance is not necessarily indicative of future returns. The following indexes were used as proxies in the performance tables: Global Stocks = MSCI ACWI; U.S. Large Cap = S&P 500; U.S. Large Value = Russell 1000 Value; U.S. Large Growth = Russell 1000 Growth; U.S. Small Cap = Russell 2000; Int’l Dev Stocks = MSCI EAFE; Emerging Markets = MSCI EM; U.S. Inv Grade Bonds = Barclays U.S. Aggregate; U.S. High Yield Bonds = Barclays Corporate High Yield; Emerging Markets Debt = JPMorgan EMBI Global Diversified; Int’l Bonds = Barclays Global Treasury ex US; Cash = 3month T-Bill; Sector returns displayed in the chart represent S&P 500 sectors, while treasury benchmarks are from Barclays
Quote of the Month
“Even the most analytical thinkers are predictably irrational; the really smart ones acknowledge and address their irrationalities.”
Dan Ariely (Duke University professor)
Chart of the Month
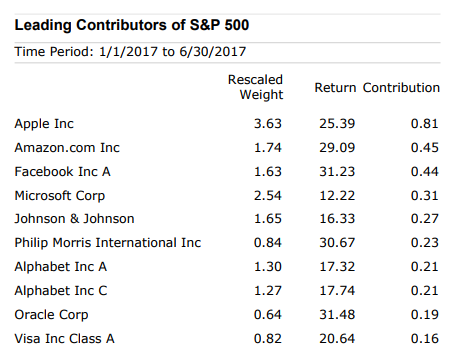
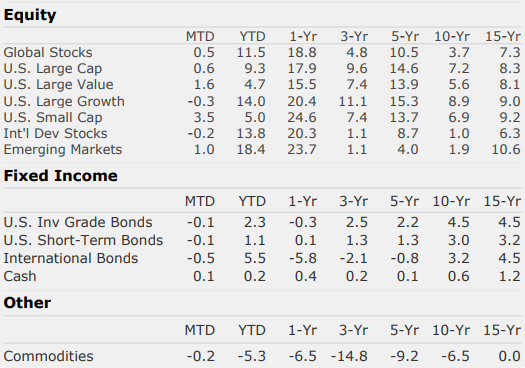
Chart of the Month
Quote of the Month
“Even the most analytical thinkers are predictably irrational; the really smart ones acknowledge and address their irrationalities.”
Dan Ariely (Duke University professor)
Trailing Returns