Market Perspectives February 2022
Capital Markets
By: Wade Austin
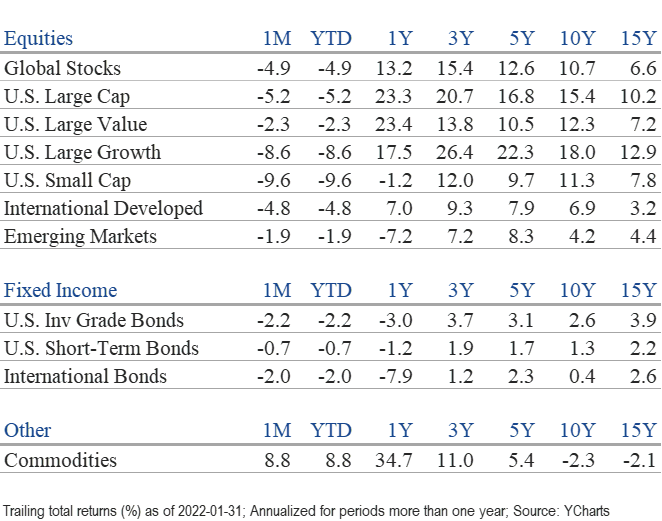
Markets began the new year on a positive note with the S&P 500 reaching an all-time high on January 3rd, the first trading day of 2022. Risky assets have stumbled since. Just three weeks later, the S&P 500 had declined 12% at January 24th’s intraday low. Thanks to a strong rally over the month’s final two days, the benchmark U.S. large-cap index recovered half its losses to post a -5.2% total return – the weakest January since 2009.
The pain among small-cap and growth stocks was more severe. The final days’ bounce enabled the tech-heavy NASDAQ index (-8.9%) to avoid its worst-ever start to a year. By month-end, the Russell 2000 small-cap index had declined -16.8% from its 11/8/2021 peak. Large, mid, and small-cap stocks each recorded their largest monthly drawdowns since March 2020. Energy (+19.1%), the lone shining star, and Financials (0.1%) were the only positive of eleven major sectors, while the worst performer was Consumer Discretionary (-9.7%).
International developed markets stocks also broadly declined (-4.8%) in January but not as much as U.S stocks. Emerging markets stocks fared best (-1.9%).
The Federal Reserve meeting notes released on January 5th revealed a potential shift from quantitative easing (QE) to quantitative tightening (QT) which spooked markets. Fed Chair Jerome Powell confirmed the hawkish pivot during his conference call on the 19th when he signaled rate hikes would begin in March. The market started to price at a much faster pace of Fed tightening this year, and their valuation rerating affected higher P/E and longer duration growth stocks the most. Geopolitical concerns involving Russia and China also weighed on investor sentiment.
Inflation and interest rate concerns also hindered bond returns. U.S. Treasury yields surged with the 10-year T-note climbing 27 basis points (bps) to 1.78% and the 2-year T-note spiking 45 bps to 1.18%. January marked the first time in the last 13 years that bond yields have risen during a stock market correction. All major fixed income sector indexes declined on a total return basis including broad-based U.S. aggregate bonds (-1.9%), municipal bonds (-2.7%), and U.S. investment-grade corporate bonds (-2.2%).
With the global-tightening cycle being the dominant theme going forward, lofty equity valuations amid shrinking liquidity conditions make all risky assets more vulnerable. Corporate earnings and forward guidance will carry greater significance due to valuation sensitivity, and we’ve certainly witnessed dramatic stock price swings after corporate releases this earnings season. Take for example the so-called FANG stocks. Microsoft, Apple, Google, and Amazon bounced on upbeat earnings and outlooks while Netflix and Meta Platforms (Facebook) got crushed after missing forecasted results. Companies with reliable earnings growth and the pricing power to overcome inflation will most likely outperform in the current environment.
While heightened volatility surrounding tighter monetary policy is normal, bull markets do not typically peak around the initial rate hike. Global equities have posted gains in all eight previous Fed tightening cycles over the past 40 years, averaging an 11.3% annualized return. January’s selloff may prove to be an overreaction if inflation soon peaks, economic growth continues, and corporate profit margins remain elevated.
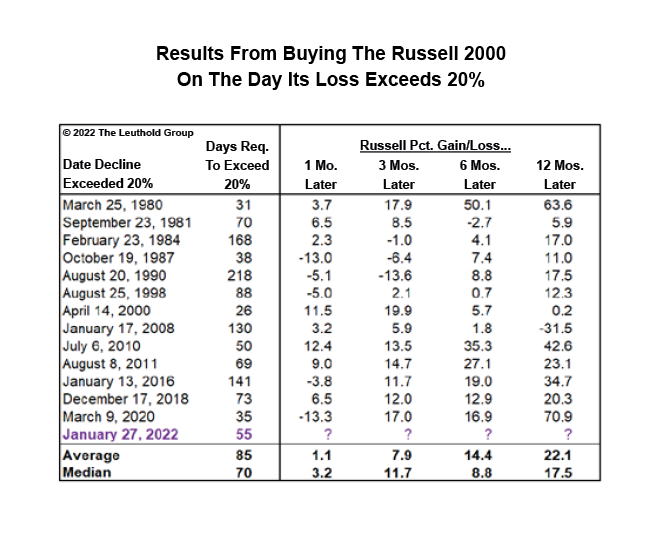
Value, international and small-cap stocks have historically performed better after the first rate hike. Small-caps reached bear market territory on January 27th. While the Russell 2000 index may drift lower, the forward returns from the date it reaches a 20% decline have been solid as shown in our Chart of the Month. With the valuations of small-caps much more modest than large caps (a trailing P/E of 17.6 vs 25.4 as of month-end), small-caps appear relatively attractive for long term investors.
Insights by John Silvia, Director of Economics

The year 2022 will be characterized by slower economic growth, slightly lower inflation (but still above target), and a Federal Reserve committed to reducing quantitative stimulus while also raising short-term interest rates. When we examine our leading economic indicators such as claims and capital goods orders, the signals remain positive.
- January’s employment report strengthens the case for continued, above-trend economic growth and several increases in the benchmark funds rate by the Federal Reserve.
- January’s employment report revealed job gains of 467,000 with private sector jobs up 444,000. The unemployment rate inched up to 4.0% as the labor force participation rate rose – a particularly good thing. The three-month average gain in jobs was 541,000 in the establishment survey – a solid number. Wages are up 5.7% over a year ago. All these numbers will keep the Fed on track for a March rate increase.
- For inflation, the persistence of price pressures has led the Federal Reserve to drop the transitory inflation story. They now expect sustained inflation going forward. This has accelerated the Fed’s outlook for tapering and raising the fund’s rate in 2022.
- The latest survey of manufacturing purchasing agents provides a good perspective. First, the overall index and both the production and orders components support the case for economic growth but at a slower pace in 2022 compared to last year. The employment component indicates further job gains and thereby personal income/spending growth. The order backlogs indicate that supply chain issues remain an issue.
- The manufacturing survey also provides evidence for a reduction in input/commodity pressures, but the level of these pressures suggests rising prices—just at a slower pace than we witnessed in the second half of 2021. Core PCE inflation, the target of Fed policy, came in at 5.8% for the last three months as of December and 4.9% over a year ago. These numbers are significantly above the Fed’s target of 2% but may be peaking.
- For all of 2022, economic growth is expected at 4.2% with strong gains in consumer spending, residential investment, and business investment. Slower economic growth tends to be associated with slower profit growth—especially in an environment of rising interest rates. Core consumer inflation is a challenge to investors as real returns on cash and sovereign debt continue negative. With the Federal Reserve now committed to reducing their expansionary policy, the stage is now set for additional volatility in financial asset prices – as evidenced by NASDAQ and technology equity prices in January.
- Benchmark Treasury yields have risen in the last month as inflation concerns and statements from Federal Reserve policymakers have emphasized a move toward ending bond purchases and a March rate increase. Persistent inflation remains an issue for Treasury debt owners and buyers. Expectations are for the 10-year Treasury rate to approach 2% by year-end.
- In contrast to the issues of inflation, the strength in the dollar exchange rate reflects the gains in U. S. growth relative to the Euro as well as the difficulties faced by Turkey and emerging markets.
- Economic policy, in terms of regulation and federal income taxes, remains a longer-term negative for investors. Any proposals for greater regulation and higher income/capital gains taxes represent a reduction in the expected rate of return on equity/corporate debt financial assets.
- Periods of accelerating and decelerating growth/inflation benchmarks can distract from the long-run goals of investors. Investment opportunities and risks change as the economic recovery evolves often due to changes in economic policy. Our view is that the economic outlook in 2022 will not be a repeat of 2021 and will be more challenging for investors.
Quote of the Month
“No one can predict with any certainty which way the next 1,000 points will be. Market fluctuations, while no means comfortable, are normal.”
Peter Lynch, American Investor and former Mutual Fund Manager
Chart of the Month
The information published herein is provided for informational purposes only, and does not constitute an offer, solicitation or recommendation to sell or an offer to buy securities, investment products or investment advisory services. All information, views, opinions and estimates are subject to change or correction without notice. Nothing contained herein constitutes financial, legal, tax, or other advice. The appropriateness of an investment or strategy will depend on an investor’s circumstances and objectives. These opinions may not fit to your financial status, risk and return preferences. Investment recommendations may change, and readers are urged to check with their investment advisors before making any investment decisions. Information provided is based on public information, by sources believed to be reliable but we cannot attest to its accuracy. Estimates of future performance are based on assumptions that may not be realized. Past performance is not necessarily indicative of future returns. The following indexes were used as proxies in the performance tables: Global Stocks = MSCI ACWI; U.S. Large Cap = S&P 500; U.S. Large Value = Russell 1000 Value; U.S. Large Growth = Russell 1000 Growth; U.S. Small Cap = Russell 2000; Int’l Dev Stocks = MSCI EAFE; Emerging Markets = MSCI EM; U.S. Inv Grade Bonds = Barclays U.S. Aggregate; U.S. High Yield Bonds = Barclays Corporate High Yield; Emerging Markets Debt = JPMorgan EMBI Global Diversified; Int’l Bonds = Barclays Global Treasury ex US; Cash = 3month T-Bill; Sector returns displayed in the chart represent S&P 500 sectors, while treasury benchmarks are from Barclays
Chart of the Month Source: The Leuthold Group
Chart of the Month
Quote of the Month
“No one can predict with any certainty which way the next 1,000 points will be. Market fluctuations, while no means comfortable, are normal.”
Peter Lynch, American Investor and former Mutual Fund Manager
Trailing Returns