Market Perspectives – January 2019
Capital Markets
Well, that escalated quickly. 2018 is in the books with the first negative stock market performance since 2008. U.S. stocks rallied to a peak in late September, but went on to experience a historically poor 4th quarter.
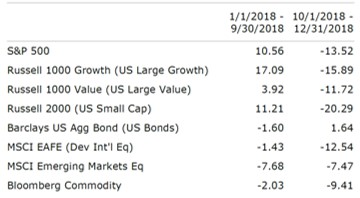
Unlike 2017, viewing 2018 markets performance in a vacuum really doesn’t tell the full story. The year can largely be divided into two parts:
- From January 1st through September 21st U.S. stocks were up more than 10%. While up, the market was highly fragmented with growth stocks – primarily the big tech, consumer, and health care – soaring while value stocks such as financials, materials, and industrials lagged. Meanwhile, outside the U.S., stocks had not rallied and in some cases, such as the emerging markets, were down sharply. Bonds had negative returns in this environment as interest rates rose. In short, a handful of U.S. based large cap stocks led market performance.
- From September 21st through December 31st the story flipped. Nearly all equity markets fell, however the previous leaders (US growth and U.S. small cap) fell the hardest. Earlier laggards, such as Emerging Markets stocks (which had been down more than 8%) fell by ~6%. Meanwhile, high quality bonds rallied in the downturn and ultimately the bond market closed with a total return of 0.01% for the year.
On Christmas Eve, the stock market briefly fell into bear market territory but closed just above. For now, the longest bull market in history lives on.
Painful Years Lead to Higher Expected Returns
Over the last few years we have continued to caution that we are getting towards the later stages of a bull market. We also have acknowledged that expected returns for the next five or ten years are lower than what we have experienced in recent years. Years such as 2018 are painful but they actually help increase expected returns. A few thoughts:
- On January 1, 2018 the Fed Funds rate was 1.5%. At the end of 2018 it was close to 2.5%. Increases in the risk free rate can often lead to lower short-term returns but inherently increase expected long-term returns across nearly all investments.
- As of the middle of 2018 we were on pace for 17% earnings growth for the S&P 500. Companies in the S&P 500 and across the U.S. market rapidly increased their profits. As more earnings fall to the bottom line, the cheaper stocks appear. Cheaper stocks lead to higher expected returns.
- When we entered 2018 the U.S. stock market appeared to be highly valued by most objective metrics. High valuations usually mean lower future returns (a low premium over cash). With the price of stocks falling across the globe in 2018, equity valuations are now lower.
In short, rising rates and lower Price-to-Earnings ratios increase future expected returns. Due to the low rate environment, we will likely remain in a lower than average return environment, but the pain of 2018 certainly helps the future outlook a bit. Here’s to a new year!
By: Dustin Barr, CFA
Quote of the Month
“The stock market is a device for transferring money from the impatient to the patient.”
Warren Buffett
Chart of the Month
The information published herein is provided for informational purposes only, and does not constitute an offer, solicitation or recommendation to sell or an offer to buy securities, investment products or investment advisory services. All information, views, opinions and estimates are subject to change or correction without notice. Nothing contained herein constitutes financial, legal, tax, or other advice. The appropriateness of an investment or strategy will depend on an investor’s circumstances and objectives. These opinions may not fit to your financial status, risk and return preferences. Investment recommendations may change, and readers are urged to check with their investment advisors before making any investment decisions. Information provided is based on public information, by sources believed to be reliable but we cannot attest to its accuracy. Estimates of future performance are based on assumptions that may not be realized. Past performance is not necessarily indicative of future returns. The following indexes were used as proxies in the performance tables: Global Stocks = MSCI ACWI; U.S. Large Cap = S&P 500; U.S. Large Value = Russell 1000 Value; U.S. Large Growth = Russell 1000 Growth; U.S. Small Cap = Russell 2000; Int’l Dev Stocks = MSCI EAFE; Emerging Markets = MSCI EM; U.S. Inv Grade Bonds = Barclays U.S. Aggregate; U.S. High Yield Bonds = Barclays Corporate High Yield; Emerging Markets Debt = JPMorgan EMBI Global Diversified; Int’l Bonds = Barclays Global Treasury ex US; Cash = 3month T-Bill; Sector returns displayed in the chart represent S&P 500 sectors, while treasury benchmarks are from Barclays
Sources: CIC, Morningstar Direct, and The Leuthold Group
Chart of the Month
Quote of the Month
“The stock market is a device for transferring money from the impatient to the patient.”
Warren Buffett
Trailing Returns