Market Perspectives August 2020
Capital Markets
By: Wade Austin
Initially propelled by an expectation smashing 4.8M June jobs gained report and sustained by the announcement of several promising phase III clinical trials for Covid-19 vaccines, equity markets continued their remarkably persistent rally in July. Impossible to have imagined back in the Spring, the S&P 500’s YTD total return rose into positive territory by July’s close – only 3.4% from its all-time high. Breadth firmed in July as 10 of the 11 S&P 500 sectors posted gains with Energy being the only decliner.
The Dow 30 (-6.1%) and Small Caps (-10.6%) haven’t kept pace YTD, but the tech-heavy Nasdaq 100 amazingly accelerated to fresh all-time highs and 25.5% YTD gains. The U.S. dollar weakened a significant 4% helping Gold surge to its highest level since 2011 and Emerging Markets rally a noteworthy 8.9% in July.
Risk sentiment also carried major fixed income sectors to positive total returns in July. On a cautious note, 2-, 5-, and 10-year U.S. Treasury yields fell to record lows by late July due to fundamental economic concerns and Congress’ lack of progress towards a new fiscal stimulus package to further bridge consumers impacted from continued lockdowns. Despite the 10-year Treasury yield dropping to 0.536% (a stunning 74% decline from 2.02% just one year ago), investor flows into bond ETFs are nearly 5X vs. equity ETF flows since the March lows.
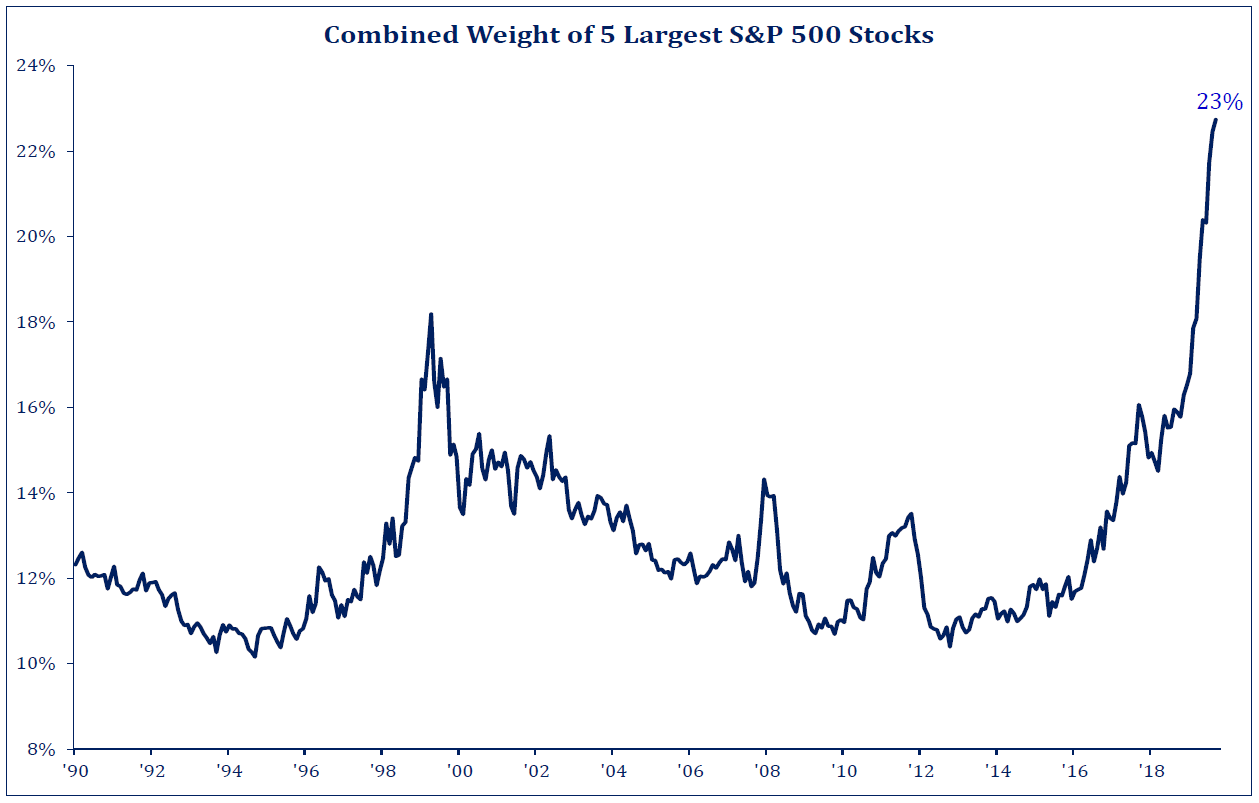
Lofty market valuations may appear on the surface to suggest a disconnect from economic reality, but the gulf between pandemic Winners and Losers became crystal clear during Q2 earnings season. The largest companies have the resources, diversity of services, and multiple revenue streams to weather storms and, in some cases, capitalize on paradigm shifts. Reported corporate earnings in July declined 35%, yet 80% of companies beat analysts’ expectations. Financials of those companies at the “scene of the accident” (i.e., Transportation, Hospitality & Leisure) remain significantly impaired. Conversely, many Technology, Communications, and Consumer Discretionary companies have benefited from e-commerce and work-from-home mandates. Apple grew revenues 11% in Q2 despite many of their retail stores being closed for most of the quarter, and its 6.5% S&P 500 market cap weight is now the single largest since IBM peaked at 6.4% in 1984.
As the analog economy struggled to return to normal, big tech’s dominance surged to historic levels. Our Chart of the Month shows that the relative valuations of the current five largest stocks (Apple, Microsoft, Amazon, Google and Facebook) rocketed past the Dot Com bubble’s previous record high. Will this time be different?
Insights by John Silvia, Director of Economics

Evidence in support for the case of continued economic growth has been delivered for both the labor and housing markets.
- July job gains came in at plus 1.8M with 592,000 of those gains from leisure and hospitality. Meanwhile, the unemployment rates for all racial groups and both genders fell, and the overall unemployment rate declined to 10.2%.
- The housing and business investment sectors also showed signs of continued improvement. Both existing and new home sales were up, and pending home sales were up 16 % in June. Moreover, home prices are up 4.5% compared to a year ago which exceeds the last two years’ pace. Capital goods orders and shipments were also up last month.
Our discipline of tracking the leading economic indicators, such as jobless claims, building permits, factory orders and consumer confidence, provide the basis for a positive economic outlook.
- Financial leading indicators, such as credit spreads and the dollar signal a return to more normal pricing. Corporate bond spreads have risen in recent weeks as the Federal Reserve’s buying of this debt has receded. Meanwhile, the trade-weighted dollar is back to early 2020 levels and above the levels of 2016-2019.
- We stay with our view that there is no V-shaped economic recovery.
For the long-term investor, structural changes are part of any recession recovery period. Certainly, travel and leisure sectors will take some time to find a new style of delivering consumer value. The application of technology for secure communications will be paramount. Online shopping will gain market share. Finally, healthcare will be a sustained, not short-run, winner.
Of course, these are the indicators we follow each week and each month, and we update them for your advisor.
Quote of the Month
“Not even thinking about thinking about raising rates.”
Federal Reserve Chairman, Jerome Powell
Chart of the Month
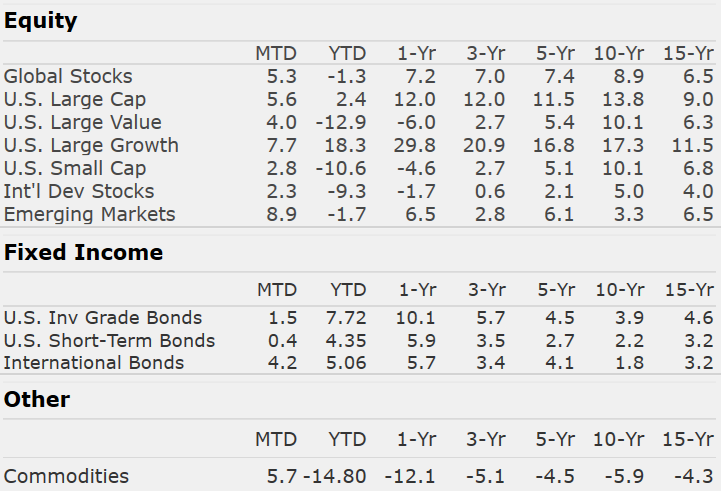
The information published herein is provided for informational purposes only, and does not constitute an offer, solicitation or recommendation to sell or an offer to buy securities, investment products or investment advisory services. All information, views, opinions and estimates are subject to change or correction without notice. Nothing contained herein constitutes financial, legal, tax, or other advice. The appropriateness of an investment or strategy will depend on an investor’s circumstances and objectives. These opinions may not fit to your financial status, risk and return preferences. Investment recommendations may change, and readers are urged to check with their investment advisors before making any investment decisions. Information provided is based on public information, by sources believed to be reliable but we cannot attest to its accuracy. Estimates of future performance are based on assumptions that may not be realized. Past performance is not necessarily indicative of future returns. The following indexes were used as proxies in the performance tables: Global Stocks = MSCI ACWI; U.S. Large Cap = S&P 500; U.S. Large Value = Russell 1000 Value; U.S. Large Growth = Russell 1000 Growth; U.S. Small Cap = Russell 2000; Int’l Dev Stocks = MSCI EAFE; Emerging Markets = MSCI EM; U.S. Inv Grade Bonds = Barclays U.S. Aggregate; U.S. High Yield Bonds = Barclays Corporate High Yield; Emerging Markets Debt = JPMorgan EMBI Global Diversified; Int’l Bonds = Barclays Global Treasury ex US; Cash = 3month T-Bill; Sector returns displayed in the chart represent S&P 500 sectors, while treasury benchmarks are from Barclays
Sources: CIC, Morningstar Direct, and Strategas
Chart of the Month
Quote of the Month
“Not even thinking about thinking about raising rates.”
Federal Reserve Chairman, Jerome Powell
Trailing Returns