Market Perspectives – August 2018
Capital Markets
U.S. stocks led the way in July as global markets posted strong monthly returns. Most notably, U.S. large cap value stocks led all other market segments to start Q3 after experiencing strong underperformance. The S&P 500 has been closing in on all-time highs made in January 2018. If new highs are made, the bull market will become the longest in history.
Bond markets posted no gains for the month as interest rates across most of the curve modestly increased. The Fed has now been tightening since December 2015 and has managed to find a gradual and orderly pace to their rate increases. Economic data continues to show strong signs of growth. The labor market continues to tighten, GDP growth is strong, consumer optimism is strong, and corporate earnings have grown at a staggering pace. Based on this data and recent comments from the Fed, we continue to believe the Fed will raise rates one to two more times this year. Given the stunning amount of monetary stimulus that was put into the economy from 2008 through 2013, we had worried about the market’s ability to digest a tightening cycle. Thus far, the Fed has done a very good job in beginning to unwind the stimulus in an orderly fashion. With that being said, the Fed has a long way to go to get to a “normal” monetary posture. The path towards normalization will likely be fraught with challenges.
2017 and the first six months of 2018 have been kind to the large tech and communication companies. The largest and most dominate players in the tech industry have experienced dramatic appreciation in their stocks. July told a different story however. Facebook experienced the largest one day drop (in dollars) in stock market history when its Q2 earnings report showed declining user counts. The stock dropped more than 18% in one day. Even with this large decline, Facebook is still flat for 2018. Some believe the disappointing earnings from Facebook, as well as some other recent disappointments from Twitter and Netflix, is a sign that expectations for the large tech firms have grown too high. Others have argued that this repricing represents a great entry point. We aren’t ready to call the tech trade dead. The dominance of the large tech companies has been nothing short of amazing. Ignoring these companies has been very costly. We expect tech to continue to perform well during this bull market but history tells us that the bull market leader tends to become bear markets laggard. While we wouldn’t ignore the tech companies, we would caution investors not to get too overexposed after many years of strong returns.
A Pulse Check on Valuations
If you are a frequent reader of Market Perspectives you know that we have been cautioning investors that expected returns for stocks and for bonds over the next five-to-seven years are likely lower than historical averages. There are two reasons for this, (1) interest rates have been low and (2) after 10 years of strong stock market returns traditional valuation metrics such as price-to-earnings are above historical averages. We continue to believe that lower returns could be ahead, but recent events may justify a small bump to return forecasts. A few thoughts
- The great debate amongst investment professionals is how to evaluate stock market levels. Many agree that price-to-earnings is a great ratio to measure levels. Many disagree on which P/E ratio to use. The three most common methods are the trailing (price/last 12 month earnings), forward (price/forecasted next 12 months earnings), or CAPE (price/average annual earnings over 10 years). CAPE has had more predictive power than other metrics.
- The CAPE ratio remains at extremely elevated levels. Bears counter that this means future returns will be dismal, while bulls argue that the CAPE includes financial crisis era earnings and doesn’t take into account inflation or low interest rates. Either way, CAPE is telling us to expect lower returns.
- Forward and trailing P/Es are telling us that things have gotten a little more rosy in 2018. Due to strong earnings growth, partly due to corporate tax cuts.
- At the beginning of 2018, the trailing P/E was at 23X compared to an average of 16X. Now, just six months later, the trailing P/E has dropped to 20X and the forward is 16X. If earnings continue to come in near forecast, the stock market will be near average historical P/E ratios (since 1990).
- Further, data that we are seeing from firms that either own or lend to private companies suggests that profitability growth in the private sector from the tax cut stimulus is very real.
- We continue to caution that expected returns will likely be muted but, we also are not sleeping on the earnings story. After a ten year bull market, it is easy to argue that it will die soon. The reality is that it doesn’t have to die soon and recent fiscal stimulus, coupled with still muted inflation, could provide upside potential.
By: Dustin Barr, CFA
All data sourced from Morningstar Direct unless otherwise noted. The information published herein is provided for informational purposes only, and does not constitute an offer, solicitation or recommendation to sell or an offer to buy securities, investment products or investment advisory services. All information, views, opinions and estimates are subject to change or correction without notice. Nothing contained herein constitutes financial, legal, tax, or other advice. The appropriateness of an investment or strategy will depend on an investor’s circumstances and objectives. These opinions may not fit to your financial status, risk and return preferences. Investment recommendations may change and readers are urged to check with their investment advisors before making any investment decisions. Information provided is based on public information, by sources believed to be reliable but we cannot attest to its accuracy. Estimates of future performance are based on assumptions that may not be realized. Past performance is not necessarily indicative of future returns. The following indexes were used as proxies in the performance tables: Global Stocks = MSCI ACWI; U.S. Large Cap = S&P 500; U.S. Large Value = Russell 1000 Value; U.S. Large Growth = Russell 1000 Growth; U.S. Small Cap = Russell 2000; Int’l Dev Stocks = MSCI EAFE; Emerging Markets = MSCI EM; U.S. Inv Grade Bonds = Barclays U.S. Aggregate; U.S. High Yield Bonds = Barclays Corporate High Yield; Emerging Markets Debt = JPMorgan EMBI Global Diversified; Int’l Bonds = Barclays Global Treasury ex US; Cash = 3month T-Bill; Sector returns displayed in the chart represent S&P 500 sectors, while treasury benchmarks are from Barclays
Quote of the Month
“It’s not whether you’re right or wrong that’s important, but how much money you make when you’re right and how much you lose when you’re wrong.”
George Soros
Chart of the Month
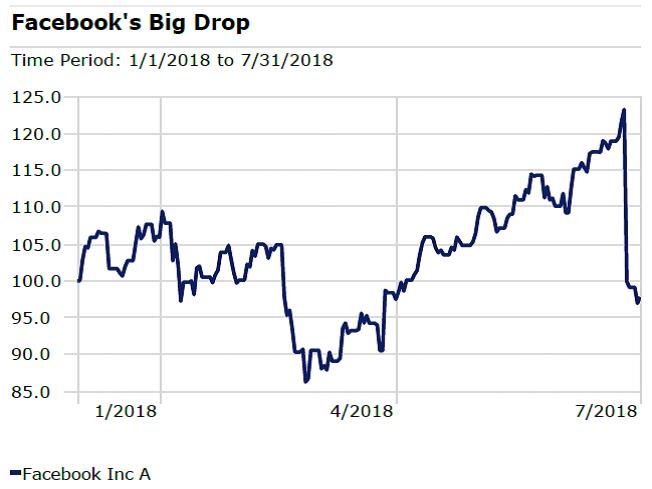
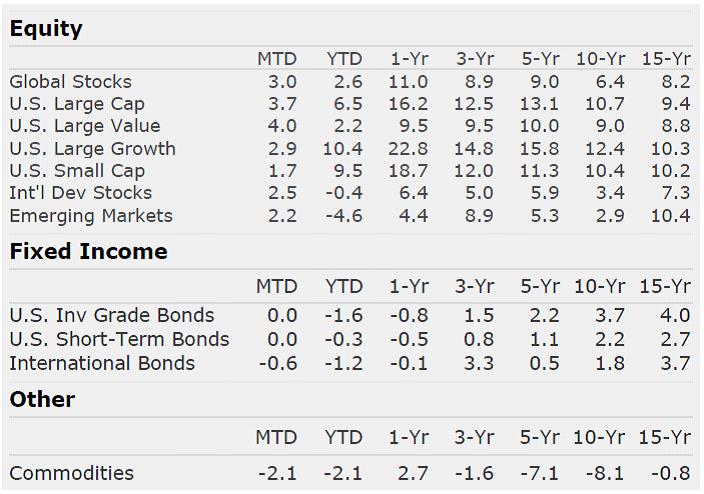
Chart of the Month
Quote of the Month
“It’s not whether you’re right or wrong that’s important, but how much money you make when you’re right and how much you lose when you’re wrong.”
George Soros
Trailing Returns