Market Perspectives – January 2020
Capital Markets
By: Wade Austin
It scarcely seemed possible one year ago – shortly after the S&P 500 dropped 9% between the Fed’s last meeting of the year and Christmas Eve – that we would be marveling at a 31% total return in the Index in 2019. The current expansion became the longest in U.S. postwar history at the end of Q2. Never having been here before in economic and market terms, it is impossible to say with any certainty what one should or should not expect from here. Still, a decade ago it would have been impossible to foresee a 0% real Fed Funds rate at the same time the unemployment rate rested at 3.5%. Yet, our most out-of-consensus view of all remains the possibility that we are not as late in the economic cycle as the consensus seemed and still seems to believe.
A sober observer would have to admit that the past decade will be a tough act to follow. The S&P 500 rose an astounding 498.5% on a total return basis since its March 9, 2009 low! All the while, the 10-yr Treasury yield fell from 2.9% to 1.9%. Most remarkable, in a way, is that a series of new highs in stock prices has not been accompanied by the euphoric “new era” thinking that so often joins manic market phases. Given the headlines in 2019 – heightened U.S. and China trade tensions, inverted yield curves, a global manufacturing slowdown, the specter of impeachment, Brexit, etc. – one could be forgiven for being a bit gun-shy.
To be sure, there is no shortage of things about which we must worry, such as the size and growth of our national debt and our querulous political and social discourse. While it does not appear that there are any imminent dangers of recession in the U.S. or global economies, the true test in the next decade may be higher inflation and the higher rates that would likely accompany it. Marginal investments made in an era of zero gravity may, in such a case, fall back to Earth.
Insights by John Silvia, Director of Economics

Trade and the Individual Investor
Over the last year, commentary on the role of trade as foreign policy and its impact on economic growth have hit the headlines. However, for the individual investor the impact of trade on investment performance can be both positive and negative.
The positive side:
Lowering trade barriers will lower the average pace of inflation thereby boosting real household incomes. This would be particularly true for workers in export oriented firms that will witness a growth in the firm’s exports. Lower trade barriers benefit individual firms (and their investors) by reducing the cost of imported goods that would be sold directly or as inputs to further production.
What’s the downside?
Lower trade barriers represent an increase in price competition for higher cost U.S. firms and their workers. In this manner, we witness the pressure on firms that would tend to produce relatively undifferentiated commodity products, for example, some textiles as well as consumer products.
Trade is a plus and minus story for investors—a good case for thoughtful investing.
Quote of the Month
“There are old investors, and there are bold investors, but there are no old bold investors.”
Howard Marks
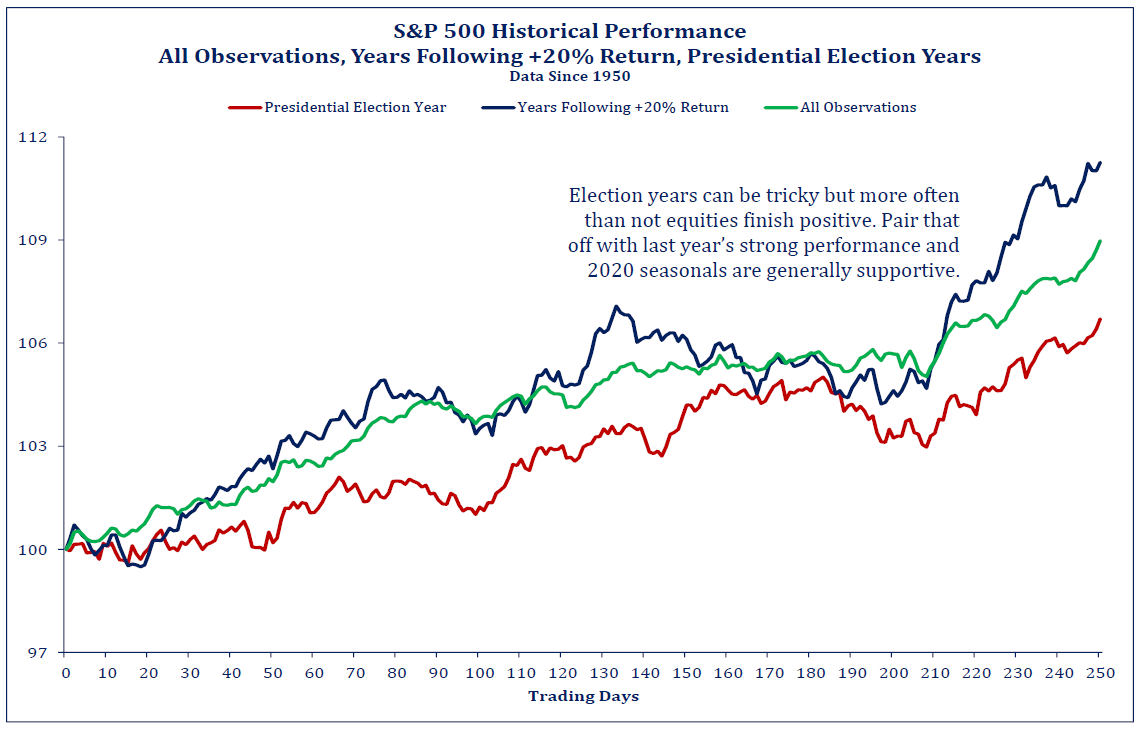
Chart of the Month
The information published herein is provided for informational purposes only, and does not constitute an offer, solicitation or recommendation to sell or an offer to buy securities, investment products or investment advisory services. All information, views, opinions and estimates are subject to change or correction without notice. Nothing contained herein constitutes financial, legal, tax, or other advice. The appropriateness of an investment or strategy will depend on an investor’s circumstances and objectives. These opinions may not fit to your financial status, risk and return preferences. Investment recommendations may change, and readers are urged to check with their investment advisors before making any investment decisions. Information provided is based on public information, by sources believed to be reliable but we cannot attest to its accuracy. Estimates of future performance are based on assumptions that may not be realized. Past performance is not necessarily indicative of future returns. The following indexes were used as proxies in the performance tables: Global Stocks = MSCI ACWI; U.S. Large Cap = S&P 500; U.S. Large Value = Russell 1000 Value; U.S. Large Growth = Russell 1000 Growth; U.S. Small Cap = Russell 2000; Int’l Dev Stocks = MSCI EAFE; Emerging Markets = MSCI EM; U.S. Inv Grade Bonds = Barclays U.S. Aggregate; U.S. High Yield Bonds = Barclays Corporate High Yield; Emerging Markets Debt = JPMorgan EMBI Global Diversified; Int’l Bonds = Barclays Global Treasury ex US; Cash = 3month T-Bill; Sector returns displayed in the chart represent S&P 500 sectors, while treasury benchmarks are from Barclays
Sources: CIC, Morningstar Direct, and The Leuthold Group
Chart of the Month
Quote of the Month
“There are old investors, and there are bold investors, but there are no old bold investors.”
Howard Marks