Market Perspectives – April 2019
Capital Markets
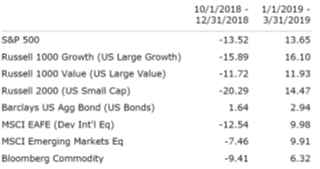
After a bruising fourth quarter 2018, we just witnessed the best Q1 since 1998 and the best quarterly S&P 500 return since 2009.
After seeing market leadership reverse in Q4 2014 with growth stocks and U.S. stocks falling by more than U.S. value and international, 2019 turned back to prior leadership trends. Value stocks and international stocks have lagged for many years.
Bonds also experienced a strong quarterly return with higher yielding bonds experiencing the benefit of spread compression and higher quality bonds benefitting from an overall decrease in longer-term interest rates. High-yield bonds remain unattractively priced with spreads well below historical averages.
In March, the 10-year U.S. Treasury rate fell below the 3 month T-Bill rate. We have been discussing the “flat yield curve” for approximately a year and have noted that the Fed likely does not want to invert the curve. Notably, the 2-year/10-year curve is not inverted, nor is the longer end (10-year/30-year) but a prolonged inversion of the 3-month and 10-year has historically predicted a recession. On average a recession occurs 14 months after initial inversion, and in many cases the stock market rallies after inversion to the top of a bull market.
It’s been noted that saying “this time is different” is a dangerous proposition in investing. However, this is the first time in history that the Fed holds large amounts of long-term paper and thus could force the curve out of inversion.
The curve inversion is just one more data point that leads us to conclude we are very late in the economic cycle. Predicting the timing or cause of a recession is challenging but generally speaking it’s worth taking note of where we are within the cycle.
Let’s Talk Recessions
There has been a lot of recession talk in the media lately. Given the cyclical nature of the economy it’s reasonable to expect that we will have another recession at some point. When the “r” word is said, it seems to invoke horrible thoughts in our brains. But what is a recession and what are the outcomes typically?
- A recession is defined as back-to-back quarters of negative economic growth. The last recession began in December 2007 and ended in June 2009.
- Since World War II ended we have had 11 recessions, but just two in the last 20 years.
- The median economic contraction was just 2.3%.
- Eight recessions coincided with an S&P 500 bear market. Of those bear markets, three were major bear markets with a decline of more than 45%, three were “minor” with a decline of between 21% and 27%. and one declined 36%..
- Of all bear markets since 1945, all but three have registered new all-time highs within three years of the end of the bull market. In all cases the market eventually made new highs.
- For younger investors who are accumulating assets, a recession and bear market is an opportunity to enter the market lower and hold for as long as possible.
- For investors near retirement or in retirement, it’s paramount to ensure your portfolio has the appropriate risk level to endure one of these cycles and weather the storm.
Quote of the Month
“People stop buying things, and that is how you turn a slowdown into a recession.”
Janet Yellen
Chart of the Month
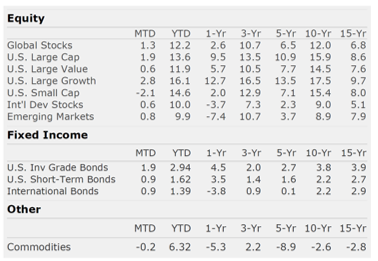
The information published herein is provided for informational purposes only, and does not constitute an offer, solicitation or recommendation to sell or an offer to buy securities, investment products or investment advisory services. All information, views, opinions and estimates are subject to change or correction without notice. Nothing contained herein constitutes financial, legal, tax, or other advice. The appropriateness of an investment or strategy will depend on an investor’s circumstances and objectives. These opinions may not fit to your financial status, risk and return preferences. Investment recommendations may change, and readers are urged to check with their investment advisors before making any investment decisions. Information provided is based on public information, by sources believed to be reliable but we cannot attest to its accuracy. Estimates of future performance are based on assumptions that may not be realized. Past performance is not necessarily indicative of future returns. The following indexes were used as proxies in the performance tables: Global Stocks = MSCI ACWI; U.S. Large Cap = S&P 500; U.S. Large Value = Russell 1000 Value; U.S. Large Growth = Russell 1000 Growth; U.S. Small Cap = Russell 2000; Int’l Dev Stocks = MSCI EAFE; Emerging Markets = MSCI EM; U.S. Inv Grade Bonds = Barclays U.S. Aggregate; U.S. High Yield Bonds = Barclays Corporate High Yield; Emerging Markets Debt = JPMorgan EMBI Global Diversified; Int’l Bonds = Barclays Global Treasury ex US; Cash = 3month T-Bill; Sector returns displayed in the chart represent S&P 500 sectors, while treasury benchmarks are from Barclays
Sources: CIC, Morningstar Direct, and The Leuthold Group
Chart of the Month
Quote of the Month
“People stop buying things, and that is how you turn a slowdown into a recession.”
Janet Yellen
Trailing Returns