Market Perspectives March 2021
Capital Markets
By: Wade Austin
February may be short on days (its last trading day was the 26th), but markets were not lacking for drama this February. Most notably and despite Fed Chair Powell’s attempt during his monthly press conference to diffuse inflation fears, rising bond yields and interest rates dominated headlines and weakened investor sentiment.
U.S. Treasury yields rose four consecutive weeks ending February at a 12-month high of 1.44%. While still well below its past 10-year average of 2.13%, the rate-of-change is spooking investors. 10-year Treasury yields began the year at 0.93%. The steepness of the rise reflects an inflation scare prompting a selloff in longer-duration assets such as intermediate and long-term bonds as well as high P/E growth stocks.
Accordingly, most fixed income sectors posted negative total returns for the month, including the U.S. aggregate bond index (-1.43%), municipal bonds (-1.59%), and investment grade corporates (-0.46%). However, lower quality credits such as high yield bonds (+0.37%) benefited from the anticipation of a strengthening economy and more shock and awe fiscal stimulus.
The S&P 500 posted a monthly gain of 2.8% and 1.7% YTD, but the degree of intra-month volatility was masked. The S&P 500 and NASDAQ 100 fell -3.1% and -6.4%, respectively, below their all-time closing highs only two weeks earlier. Energy (+22.7%) led seven of the eleven sectors into positive returns, while utilities (-6.1%) was the worst performing sector.
The bigger story within equities is that the cyclical rotation (noted in recent editions) picked up steam in late February with value stocks (+5.1%) outperforming growth (-0.8%) by month’s end. The rotation from prior coronavirus winners to the laggards accelerated into March as the rapidly declining virus cases drive economic reopen optimism which favors value stocks. Rising rate concerns are forcing a repricing of growth and some EM stock valuations. Small cap stocks, up 11.6% YTD, have been the biggest winners of the reopen trade.
Today, investors are presented with broadly expensive equity markets along with unappealing fixed-income alternatives. This March we transition from year 1 of this bull market. We expect year 2 to be more frustrating but not bad. Year 1s are typically financially rewarding but intellectually hard to comprehend as the recession’s damage remains visible. Year 2s can be the opposite. The economic recovery is obvious, but the market is kind of a grind.
Unlike during the dot.com bubble’s peak, recent stock market weakness remains narrow with the “average stock” outperforming the mega-caps. Such market breadth is not historically associated with peaks. We resist the temptation to be fearful.
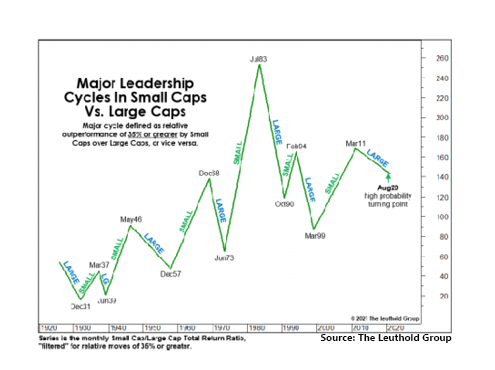
No sub-asset class has been hotter than small cap stocks. From September 1, 2020 through February 26, 2021, the Russell 2000 outperformed the S&P 500 by 31.9%. While small caps appear short-term overbought, the magnitude of this momentum is typically reserved for the early innings of a broad advance. While not quite yet at the 35% threshold for Leuthold’s “official” confirmation, our Chart of the Month suggests we may be on the cusp of a major trend change.
Insights by John Silvia, Director of Economics

We have been rewarded as investors by our adherence to the fundamentals of markets and the economy. The latest economic growth estimates for the first half of 2021 intimate a gain of 4%+ for the overall economy with solid performances for the consumer, residential (housing) and business investment. Inflation remains modest but the market’s assessment of inflation is moving upward. Meanwhile, benchmark 10-Year Treasury yields and interest rates are also moving upward.
- Leading indicators support continued growth going forward. Manufacturing surveys point to stronger orders, production, and employment. Commodity prices (copper and oil) are consistent with increasing industrial production. Therefore, the outlook favors better economic growth, but also note that with better growth comes higher inflation and interest rates.
- Gradually, vaccinations are becoming more widespread and this will offset the reoccurrence of mandated shutdowns in some states that have weakened the economic outlook for leisure and hospitality sectors.
- There are global differences in the outlook that would merit a review of your global portfolio. The outlook for stronger growth in Asia remains as we have witnessed from the China trade and PMI surveys. However, the Euro area appears on the precipice of a recession. Emerging markets benefit from exports to industrialized U.S. and Asian economies, but certain indebted economies are under the strain of rising interest rates.
- The consumer engine, the largest component of the economy continues to be supported by the gains in jobs and wages. Looking forward, reopening the economy will lead to job/income gains. In addition, household wealth remains at an all-time high in the latest quarter as equity values and home prices continue to rise.
- Each recession/recovery presents structural challenges to certain segments of the economy. For the current period, sectors such as restaurants, hotels, and retail/office real estate have been impaired. Even here, however, recent prices have attracted long-term investors who anticipate a turnaround in communities with favorable demographic/job trends.
- Clients have been rewarded by following the fundamentals and taking a longer view of their position. Recessions are part of the economic cycle, but recovery and expansion are longer lasting. This has not changed. However, inflation and interest rates are rising and there are growing disparities in the global outlook. All this merits a portfolio review with your financial advisor.
Quote of the Month
“The stock market is never obvious. It is designed to fool most of the people, most of the time.”
Jesse Livermore, legendary American stock trader
Chart of the Month
The information published herein is provided for informational purposes only, and does not constitute an offer, solicitation or recommendation to sell or an offer to buy securities, investment products or investment advisory services. All information, views, opinions and estimates are subject to change or correction without notice. Nothing contained herein constitutes financial, legal, tax, or other advice. The appropriateness of an investment or strategy will depend on an investor’s circumstances and objectives. These opinions may not fit to your financial status, risk and return preferences. Investment recommendations may change, and readers are urged to check with their investment advisors before making any investment decisions. Information provided is based on public information, by sources believed to be reliable but we cannot attest to its accuracy. Estimates of future performance are based on assumptions that may not be realized. Past performance is not necessarily indicative of future returns. The following indexes were used as proxies in the performance tables: Global Stocks = MSCI ACWI; U.S. Large Cap = S&P 500; U.S. Large Value = Russell 1000 Value; U.S. Large Growth = Russell 1000 Growth; U.S. Small Cap = Russell 2000; Int’l Dev Stocks = MSCI EAFE; Emerging Markets = MSCI EM; U.S. Inv Grade Bonds = Barclays U.S. Aggregate; U.S. High Yield Bonds = Barclays Corporate High Yield; Emerging Markets Debt = JPMorgan EMBI Global Diversified; Int’l Bonds = Barclays Global Treasury ex US; Cash = 3month T-Bill; Sector returns displayed in the chart represent S&P 500 sectors, while treasury benchmarks are from Barclays
Sources: Strategas, The Leuthold Group
Chart of the Month
Quote of the Month
“The stock market is never obvious. It is designed to fool most of the people, most of the time.”
Jesse Livermore, legendary American stock trader
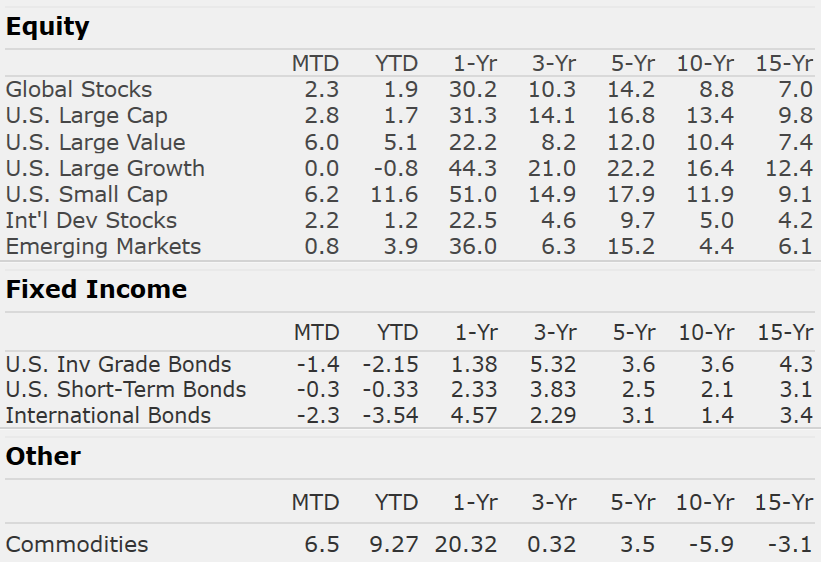
Trailing Returns